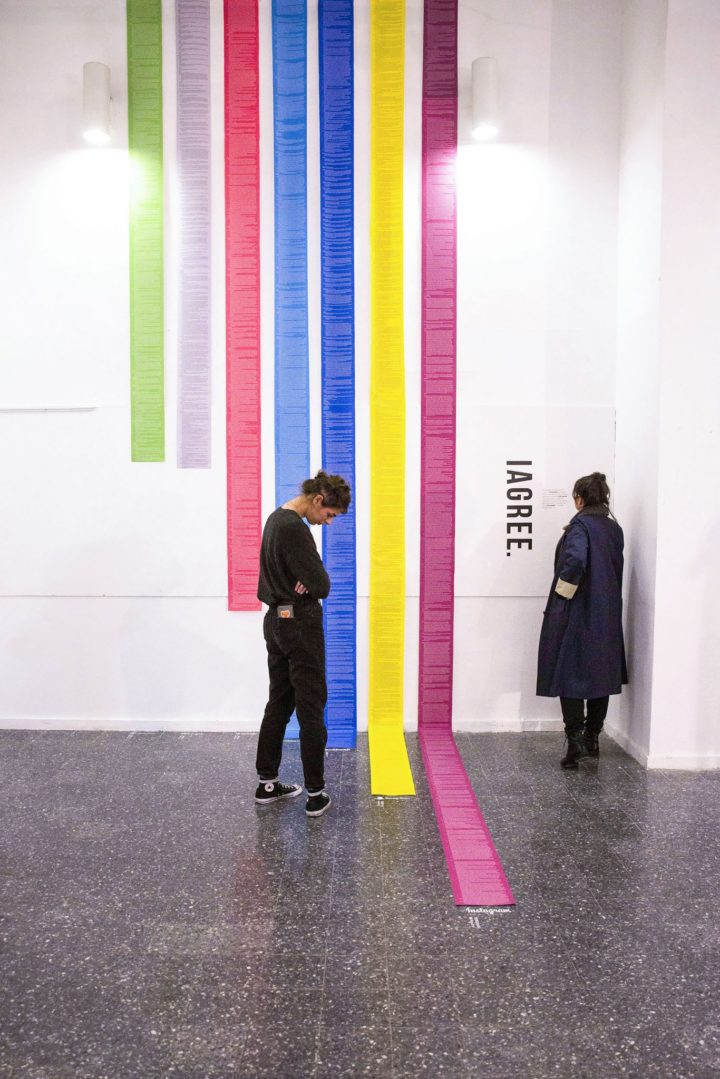
• Membership
  • Newsletter
  • Projects
  • Learning
  • About
  • Member Login
  • Data Underload  /  gender, income, work

    Who Earns More Income in American Households?

    Compared to 1970, a shift towards women making the higher income.

    Read More
  • Time map shows locations based on how long it takes to get there

    September 24, 2017

    Topic

    Maps  /  mapbox

    With the premise that we often search for locations based on how long it takes to get there rather than where they actually are in physical space, the time map by Mapbox sheds all of the latter. Placing yourself in the center, the time map shows locations in the direction you have to go and the minutes it takes to get there.

    By removing literal geography, we now have a map that more closely reflects the way we think about our environment: a cluster of restaurants “five minutes that way” versus “ten minutes the other.” We can watch our surroundings literally expand and contract with different means of travel. And only after choosing a destination do we think about roads, turns, and the specifics of how to get there.

    Give it a go.

  • Thermal structure of Hurricane Maria

    September 21, 2017

    Topic

    Maps  /  hurricane, NASA, weather

    Hurricane Maria touched down in Puerto Rico. This visualization by Joshua Stevens at NASA shows what the thermal structure of the storm looked like, based on data collected by the Terra satellite.

    Colder clouds, which are generally higher in the atmosphere, are shown with white. Somewhat warmer, lower clouds appear purple. The image reveals a very well-defined eye surrounded by high clouds on all sides—an indication that the storm was very intense.

    Ugh.

  • Stack Overflow salary calculator for developers

    September 21, 2017

    Topic

    Statistics  /  salary, Stack Overflow, work

    Stack Overflow used data from their developer survey to build a prediction model for salary, based on role, location, education, experience, and skills. The result was a salary calculator that you can use to gauge how much you should be making.

    In this salary calculator, we report a predicted salary for the location, education, experience, and other information you enter. We also report a 50% prediction interval. The specific statistical meaning of this interval is that we expect 50% of people with the same characteristics as you to have salaries within that range; it spans the 25th to 75th percentiles. The interval is just as important as the prediction itself (the 50th percentile), because it gives you an understanding of what the range of expected salaries could be.

    Nifty.

  • Looking for improbably frequent lottery winners

    September 20, 2017

    Topic

    Statistics  /  lottery

    After hearing the story of reporter Lawrence Mower, who discovered fraudsters after a FOIA request in Florida, a group for the Columbia Journalism Review and PennLive looked to expand on the analysis.

    Intrigued, we wanted to chart new territory: to find out whether these repeat winning patterns exist across the country. We decided to submit public records requests in every state with a lottery—an adventure in itself given that FOIA laws vary significantly by state. In all, we sent more than 100 public record requests to lotteries for information about their winners, game odds, and investigative reports. Getting those records wasn’t simple, as we outline below.

    See more details.

    This should be turned into a class project for Stat 101 courses.

  • Visual narrative of six asylum seekers

    September 20, 2017

    Topic

    Infographics  /  asylum, migration

    We often visualize migration and people movement as lines that go from point A to point B. While this can be interesting for overall trends, we lose something about the individuals leaving their home and traveling in hopes to find something some better. Federica Fragapane, in collaboration with Alex Piacentini, focuses in on six people leaving point A for point B to tell their stories.

  • LEGO color scheme classifications

    September 19, 2017

    Topic

    Statistics  /  color, LEGO

    Nathanael Aff poked at LEGO brickset data with some text mining methods in search for recurring color schemes in LEGO sets. This is what he got.

  • Computer uses wind to mine cryptocurrency and then fund climate research

    September 18, 2017

    Topic

    Data Art  /  climate, crytocurrency

    HARVEST is an art piece by Julian Oliver that consists of a 4G-connected waterproof computer connected to a wind turbine. While it is powered by the wind, the computer mines for for cryptocurrency, and earnings are then cashed out as donations to climate change research organizations. Yeah.

  • Semiotic, a visualization framework

    September 15, 2017

    Topic

    Software  /  framework, React

    Elijah Meeks released Semiotic into the wild. It’s a framework that allows quick charts but provides flexibility for custom stuff.

    Semiotic is a React-based data visualization framework. You can see interactive documentation and examples here. It satisfies the need for reusable data visualization, without committing to a static set of charting types. It came out of a need for a data visualization framework that let us make simple charts quickly without committing ourselves to using only those charts. Semiotic incorporates the design and functionality of more complex data visualization methods as a response to the conversation these simple charts might begin.

    Saving this for later, if just for the sketchy fills.

  • Aviation tracker with depth

    September 15, 2017

    Topic

    Maps  /  flights

    I’ve grown bored of maps that show commuter traffic, but for whatever reason, air traffic maps continue to seem interesting. Add this fun experiment by Jacob Wasilkowski to the list. Like any other tracker, the aviation tracker shows where planes are at any given moment, but there’s one small twist. The plane icons are sized by elevation. So if you’re staring down from above, planes that are closer to you appear larger, and those closer to the ground appear smaller.

    By the way, the data comes from ADS-B Exchange if you’re interested.

  • How I Made That: Searchable Time Series Chart

    When there are too many options or categories, it can be helpful to make the data searchable.

  • Tour of Saturn through Cassini, the satellite that crashes on Friday

    September 14, 2017

    Topic

    Maps  /  National Geographic, Saturn, space

    About two decades ago, the Cassini satellite headed towards Saturn and has been orbiting the planet for 13 years. The satellite is scheduled to crash into Saturn’s atmosphere on Friday so Nadia Drake and Brian T. Jacobs for National Geographic toured through the satellite’s best finds. This is quite the scroller and feels pretty grand.

    No matter how many times it happens, it still blows my mind that satellites are sent into space for decades, reach their destination, and can still send data all the way back to us.

  • Infographic design sins in meme form

    September 13, 2017

    Topic

    Design  /  meme, sins

    Visual editor Xaquín G.V. recently used the distracted boyfriend meme to represent our attraction to novel visualization methods when a simple and visually sound method is right there at our disposal.

    Then he ran with it to illustrate his professional sins as an editor for a news desk.

  • Data Underload  /  gender, work

    Most Female and Male Occupations Since 1950

    The shifting majorities of the sexes in the workplace.

    Read More
  • Landsat satellite imagery browser

    September 11, 2017

    Topic

    Maps  /  Esri, satellite

    Downloading and viewing satellite imagery is a bit of a process. There are lot of images, and pictures aren’t taken in the exact same spot (because they’re taken from a satellite). The Landsat Viewer makes the viewing a bit easier. Just click and drag the area, select the source, and you’re off. There may or may not be wizardry involved.

  • Comparing the strength of Hurricane Irma against previous hurricanes

    September 9, 2017

    Topic

    Statistical Visualization  /  hurricane, New York Times

    For perspective, The New York Times compares the strength of Hurricane Irma to hurricanes from the past 50 years that reached Category 3. They transition through three views in the scroller, which would probably be too advanced on their own, but I think the short notes and focus on Irma gets the charts over the hump.

  • Mortgages in terms of years of working life

    September 8, 2017

    Topic

    Maps  /  income, John Nelson, mortgage

    Buying a house is often confusing and complex, compounded by a dollar sign followed by too many commas and zeros. So John Nelson broke it down to something more simple. How many annual salaries would it take to buy a house? He applied it to his own family situation and then expanded it to the country on a county level.

    Of course that’s not how mortgages actually work. It’s much worse than that. But this was the concrete visual of the trade required to land a house. I felt the Nelson family had no future there, if our plans in any way involved home ownership.

    How many working years will it take you?

  • Thirty years of hurricanes

    September 7, 2017

    Topic

    Statistical Visualization  /  Axios, hurricane

    After their graphic for thirty years of floods, Axios follows up with thirty years of Atlantic hurricanes. Each area represents the wind speed and time of a hurricane, and color represents the category.

  • Cost of Hurricane Harvey

    September 6, 2017

    Topic

    Statistical Visualization  /  hurricane, Upshot, weather

    Kevin Quealy for The Upshot charted the estimated cost of Hurricane Harvey, along with the cost of storms past, going back to 1980. I like the animated bands for the Harvey estimates — kind of like a neon light.

    If you’re interested in the data, you can grab it from NOAA.

  • Page 155 of 391
  • <
  • 1
  • ...
  • 152
  • 153
  • 154
  • 155
  • 156
  • 157
  • ...
  • 391
  • >

Analyze, visualize, and communicate data usefully, beyond the defaults.

Become a member →

Recently for Members

May 8, 2025
When the data is not what it seems

May 1, 2025
Finding the Right Charts

April 24, 2025
Visualization Tools, Datasets, and Resources – April 2025 Roundup

April 17, 2025
Breaking Out of Chart Software Defaults

April 15, 2025
Line Chart with Decorative Neon Accents

Browse by Chart Type See All →

Connected Scatter Plot Grid Map Spiral Chart Variable Width Bar Chart Timeline Area Chart Dot Plot Voronoi Diagram Glyph Chart Moving Bubbles

Browse By Topic

  • Visualization

    Seeing data

  • Maps

    Seeing geographic data

  • Infographics

    Explaining data

  • Networks

    Connecting data

  • Statistics

    Analyzing data

  • Software

    Working with data

  • Sources

    Getting data

  • Design

    Making data readable

Get the Book

Visualize This: The FlowingData Guide to Design, Visualization, and Statistics

Available now.

Order: Amazon / Bookshop

Made by FlowingData

  • The Process

  • Data Underload

  • Chart Everything

  • Guides

  • Books

  • Shop

  • About
  • Contact
  • Newsletter
  • LinkedIn
  • Instagram
  • Bluesky
  • RSS
Copyright © 2007-Present FlowingData. All rights reserved.