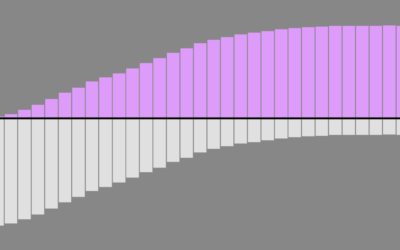
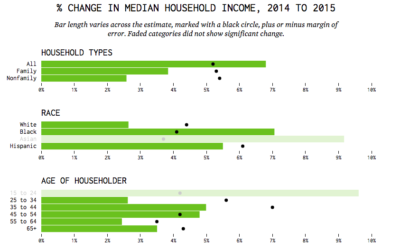
Bar Chart
The old standby. The classic. The bar height or length represents data. The baseline starts at zero.

How People Meet Their Partners
"So how'd you two meet?" There's always a story, but the general ways people meet are usually similar. Here are the most common.
Baby-Making Age
We looked at prime dating age and when people usually marry. Now it's time for the next step in the circle of life.
Ask the Question, Visualize the Answer
Let's work through a practical example to see how asking and answering questions helps guide you towards more focused data graphics.

Cuisine Ingredients
What are the ingredients that make each cuisine? I looked at 40,000 recipes spanning 20 cuisines and 6,714 ingredients to see what makes food taste different.
Basketball Stat Cherry Picking
Wow your friends during the game with random win percentages, based on various player stats.
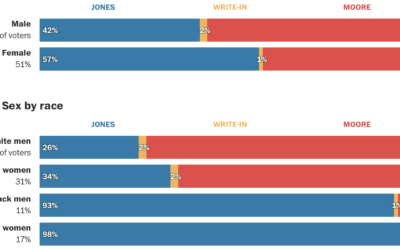
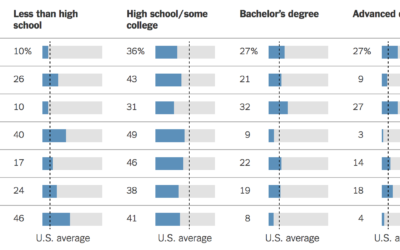
Alabama voter demographics
Democrat Doug Jones won in the senate race against Republican Roy More last…

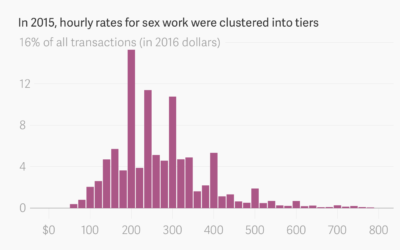
Changing internet markets for sex work
The internet changed how sex workers and clients find each other and how…
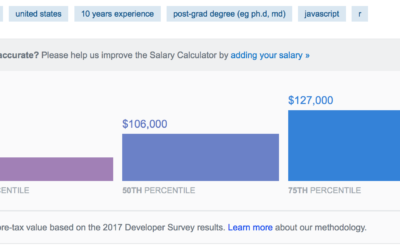
Stack Overflow salary calculator for developers
Stack Overflow used data from their developer survey to build a prediction model…
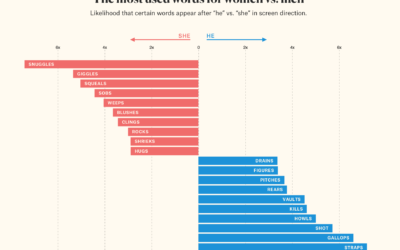
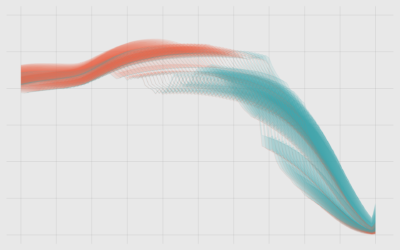
He vs. She in film screenplay direction
In screenplays, there are directions that tell actors and actresses what to do…
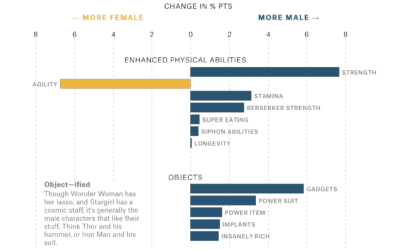
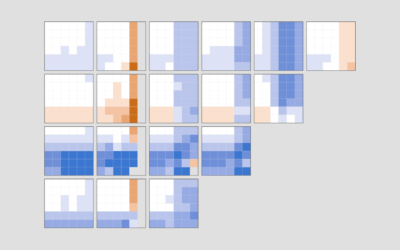
Gender representation in comic books
Amanda Shendruk for The Pudding analyzed how genders are represented differently in comic…
Income Taxes You Would Pay in Each State
Some states have high rates. Some have low. But whether a state is lower or higher for you depends on more than just the high brackets.

How to Spot Visualization Lies
Many charts don't tell the truth. This is a simple guide to spotting them.
Demographics for immigrants from banned countries
As I’m sure you know, the current administration banned immigrants from seven countries…
Shift Your Point of View to When America Was “Better”
How good or bad something is depends on what you compare against.


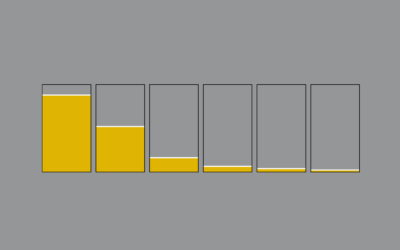
How to Visualize Proportions in R
There are many ways to show parts of a whole. Here are quick one-liners for the more common ones.
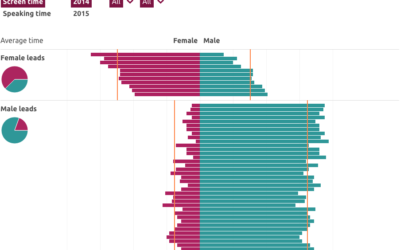
Computed screen time for men and women
In a collaborative effort, the Geena Davis Institute on Gender in Media computed…
How Much Alcohol Americans Drink, in 2014
Most people have one or two drinks on average, but some consume much more.