Income Taxes You Would Pay in Each State

Income taxes were due last week, and like many, I waited until the last day to pay the remainder of what we owed. It stung a little bit, and I wondered what my taxes would look like if I lived in a different state.
California has the highest marginal rate at 13.3 percent, but that only affects income greater than a million dollars. So most people never get to that point. Brackets. That’s the first thing to consider.
Then there are deductibles and exemptions. Some states don’t provide exemptions or tax credits for dependents, some states provide larger standard deductions than others, and some states calculate your tax liability on your federal taxes.
So it’s not as simple as just putting your numbers into the brackets or looking at the states with the lowest and highest marginal rates. You have to consider the variables for a more complete picture.
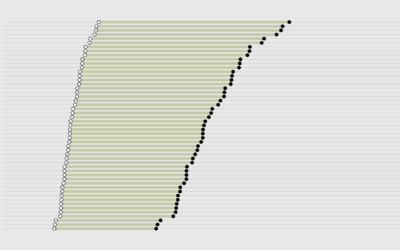
The chart below lets you enter your income, your filing status, and number of dependents to see what percentage of your income you would pay if you lived in each state. States order from highest to lowest effective rate.
There are seven states with no income tax: Alaska, Florida, Nevada, South Dakota, Texas, Washington and Wyoming. These states generate funds through other taxes like sales and property. New Hampshire and Tennessee only tax dividend and interest income, so I only include them for reference.
As you shift income from left to right, you’ll notice the rates increase too as you venture into higher tax brackets. Similarly, as you shift income from right to left, you notice rates decrease too as you move back into lower brackets.
Order of the states also changes a lot. For example, California starts closer to the bottom for lower incomes and then moves up the rankings as wealthier households have to pay higher rates. States like Pennsylvania and Utah have a flat rate, which you notice more in the lower incomes.
On the other hand, Oregon stays on top for the most part, because for single filers, rates start at 5 percent and then move up to their maximum of 9 percent once adjusted income goes over $8,400.
But like I said, it all comes down to your own financial situation. And there are a lot of possible situations that tax laws must accommodate.
Notes
- Tax Foundation compiles bracket information each year. I got the brackets and rates from there and then referred to state pages for specific information on deductions and exemptions.
- I used standard deductions, but your actual deductions will change if you itemize.
- Please don’t use this for your actual taxes. For one, this is for 2016 and numbers change each year to adjust for inflation or update for new laws. Also, I am not a tax professional. So, please use this chart for general information only.
- I calculated taxes in R and made the visualization with d3.js.
Chart Type Used

Become a member. Support an independent site. Get extra visualization goodness.
See What You Get