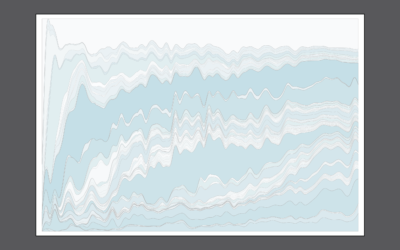
Area Chart
The space between the data and the baseline is filled with a color or a pattern, usually emphasizing counts or percentages for a single variable.
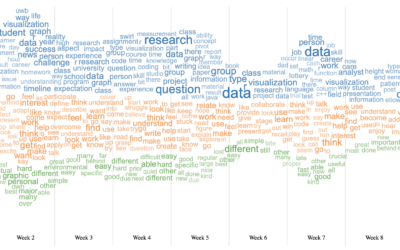
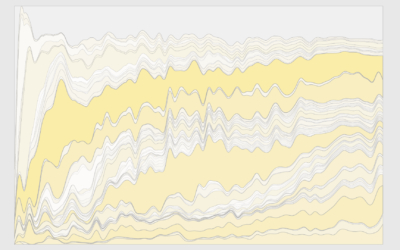
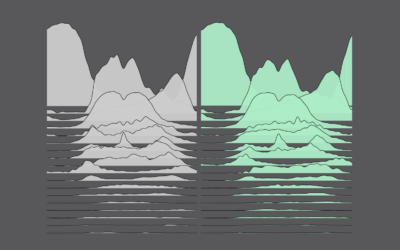
Word cloud + Streamgraph = WordStream
I hear it all the time from chart purists. “I love the streamgraph!”…
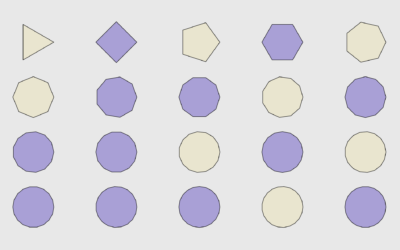
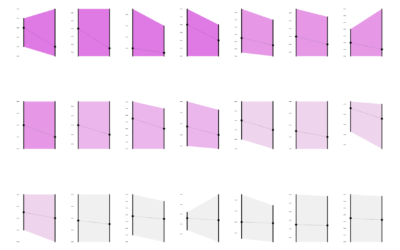
How to Draw and Use Polygons in R
R provides functions for basic shapes, but you can also draw your own for maximum fun.
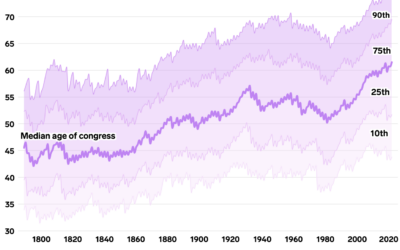
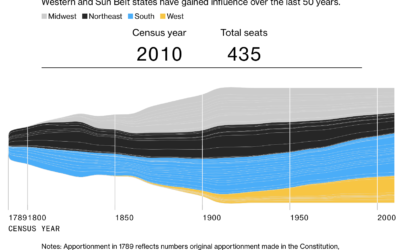
Oldest U.S. government
Annie Fu, Walt Hickey, and Shayanne Gal, for Insider, show the disproportionately aging…
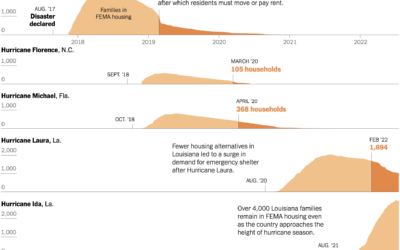
Housing displacement after disasters
Christopher Flavelle, for The New York Times, reported on the lack of support…
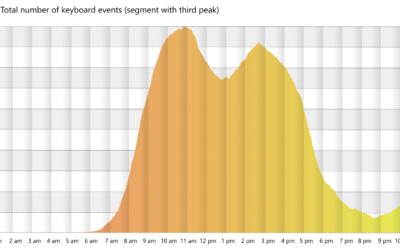
Working the triple peak
Microsoft researchers analyzed keystrokes by time of day, for a sample of Microsoft…

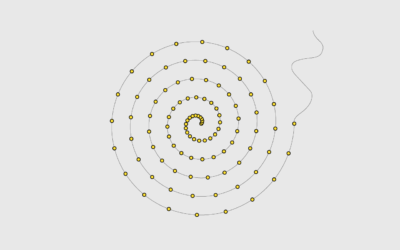
Your place in the world population
Population.io by World Data Lab asks your birthday, country of residence, and gender.…
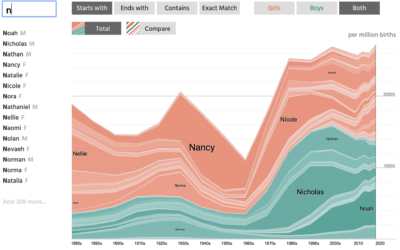
NameGrapher to explore past baby name trends
NameGrapher is an interactive chart that lets you explore historical trends for baby…
Reducing the risk of nuclear war
For Our World in Data, Max Roser discusses the risk and possible destruction…
Debating About Visualization – The Process 172
The discussions this week felt familiar. Probably because we've seen this many times, since the beginning of charts themselves.
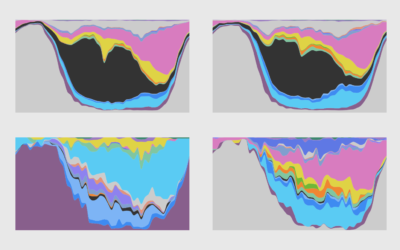
How to Make a Custom Stacked Area Chart in R
You could use a package, but then you couldn't customize every single element, and where's the fun in that?
Television Genres Over Time
Here's how the distribution of genres has changed since 1945 up to present.
How Men and Women Spend Their Days (2020)
Using an oldie but goodie visualization format to look at time use between different groups.

Daily Routine, 2020
After looking at how much time we spent on daily activities in 2020, let's look at when we spent our time.
How We Spent Our Time in 2020 Versus 2019
Our everyday routines changed over the past year, and with the 2020 American Time Use Survey, we can see by how much.
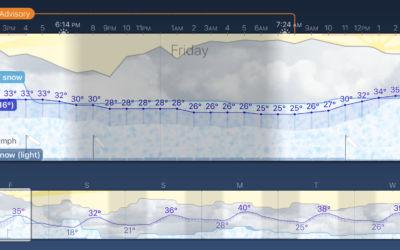
Weather Strip, an app that shows the forecast as a time series
Weather Strip is a new weather app by visualization researcher Robin Stewart. It…
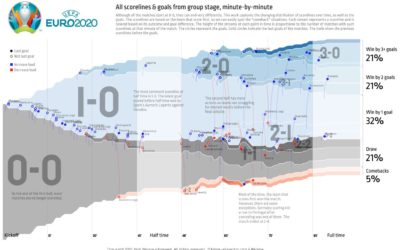
All the matches from Euro 2020 in one chart
To see all the matches from the group stage of Euro 2020 in…
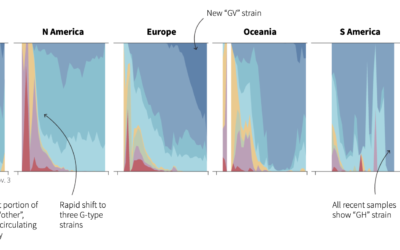
Evolution of coronavirus strains
Reuters looked at how seven main strains of the virus evolved around the…