Area Chart
The space between the data and the baseline is filled with a color or a pattern, usually emphasizing counts or percentages for a single variable.
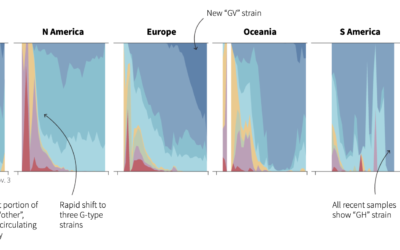
Evolution of coronavirus strains
Reuters looked at how seven main strains of the virus evolved around the…
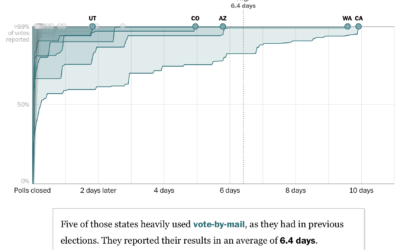
Election night might take weeks
For The Washington Post, Ashlyn Still and Kevin Schaul charted how long it…
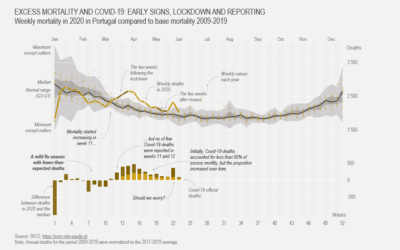
How to Make a Customized Excess Mortality Chart in Excel
Show current evolution against expected historical variability and add one or more series that could account for the difference.

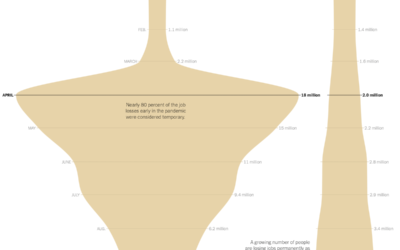
Shifts in Job Distribution
In the 1950s, almost half of all employed people were either in farming or manufacturing. As you can imagine, work changed a bit over the years.

Saving for Retirement and Age
People tend to have more money saved up over time, but range and variation also grow, and often it’s not enough.

How Much the Everyday Changes When You Have Kids
I compared time use for those with children under 18 against those without. Here's where the minutes go.

Cost of College
We know that more education usually equals more income, but as the cost of education continues to rise, the challenge to earn a college degree also increases.

Growth of Subreddits
As of September 2018, there were 892 million comments for the year so far, spread out over 355,939 subreddits. Here's how it got to this point, and "what the internet has been talking about" during the past 12 years.
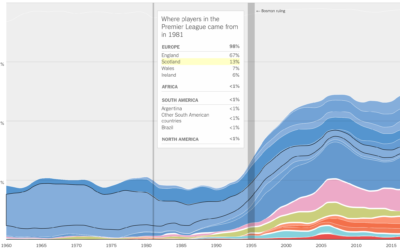
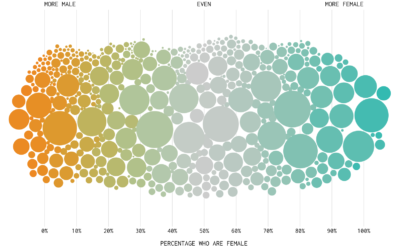
Where athletes in professional sports come from
Sports are growing more international with respect to the athletes. Gregor Aisch, Kevin…
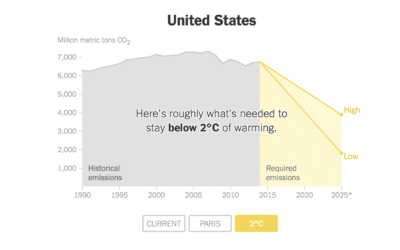
Carbon emissions goals vs. current paths
Brad Plumer and Nadja Popovich reporting for The New York Times:
Under the…
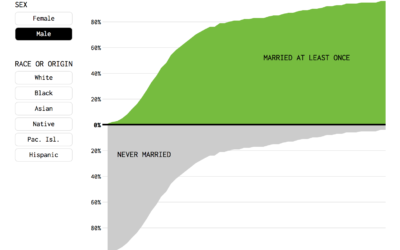
Percentage of People Who Married, Given Your Age
Or, given your age, the percentage of fish left in the sea. Here's a chart.
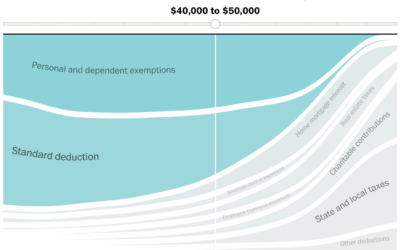
Given your income, most beneficial tax breaks
With the release of the Republican proposed tax plan, Reuben Fischer-Baum and Kevin…
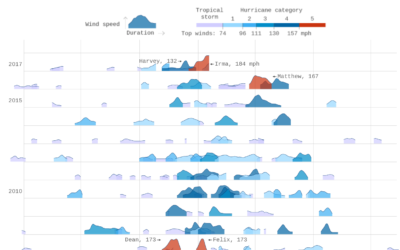
Thirty years of hurricanes
After their graphic for thirty years of floods, Axios follows up with thirty…
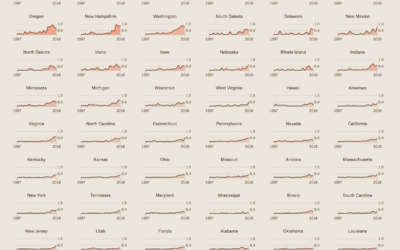
Finding the craft beer capital of America
You had me at craft beer. Russell Goldenberg for The Pudding looks for…
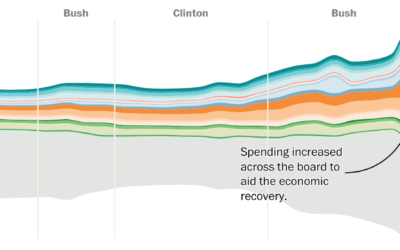
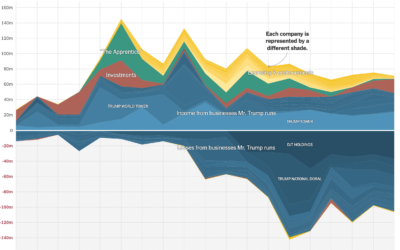
Shifting national budget
The Washington Post looks at the shifting national budget over the past 40…
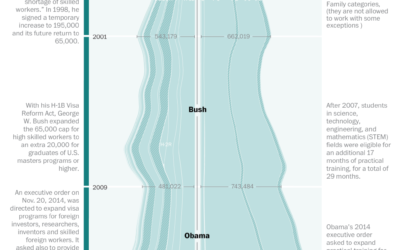
Visa restrictions and possible impact on innovation
The Washington Post talked to three experts on the American workforce and innovation…

Marital Status by Age
Separately, we looked at marrying age, divorce rates, and those who never married. Now let’s look at marital status all together, with the addition of the widowed status.