I know next to nothing about soccer (a.k.a. football), but I gotta admit…
Nathan Yau
-
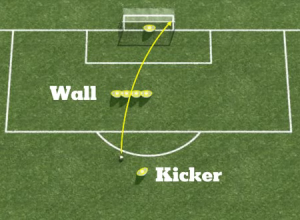
Free kick mechanics explained
-
Dabble DB acquired by Twitter
Smallthought Systems, the group behind Dabble DB, the easy-to-use online database system and…
-
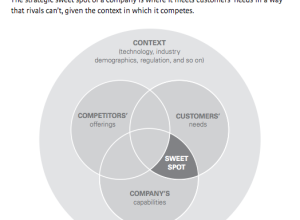
Profitable sweet spot for startups
Gosh, it’s so easy. I’m going to be rich. Get the strategic sweet…
-
Maps and data score big grants from Knight News Challenge
Since 2007, the Knight News Foundation has awarded millions of dollars in grants…
-

Glasses: the ultimate image changer
This is hilarious and uber creative advertising. If I wore glasses, I’d totally…
-

FlowingData stickers!
I love the Apple logo and all, but my Macbook really needed some…
-
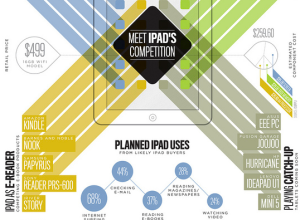
Meet iPad’s competition
Light on the data, heavy on the aesthetics. Super pretty by Section Design.…
-
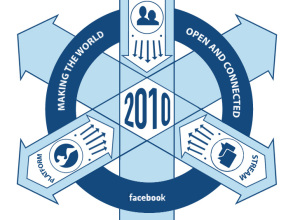
Facebook cultish insignia
When asked to take off his hoodie during D8, Facebook CEO Mark Zuckerberg…
-
Visualization underneath the surface
Moritz Stefaner of Well-formed data gives thought to propositional density as it pertains…
-
Turning information into action – 10 Tactics
Tactical Tech, the group that brought you Maps for Advocacy and Visualizing Information…
-
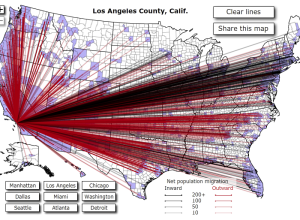
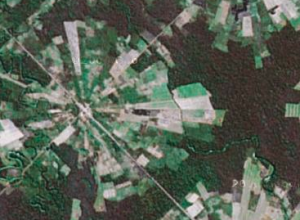
Where Americans are moving
Jon Bruner of Forbes reports that more than 10 million Americans moved from…
-
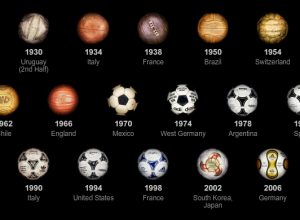
Evolution of the World Cup ball
With the World Cup in full swing, the New York Times has been…
-
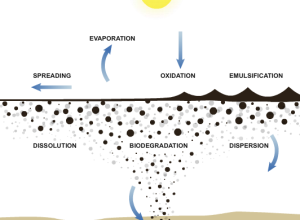
Physics of oil spills explained
What exactly is going on with all the oil spewing into the Gulf,…
-
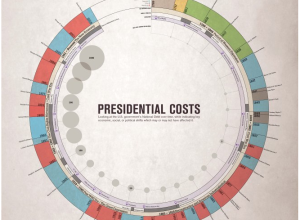
History of the United States in a circle
Presidential Costs by Rachel Mercer offers a look at the history of the…
-
Landscape chartspotting
We saw math principles in nature. Now how about charts? Andy Woodruff does…
-
Twitter parade in your honor
This is completely useless in the good sort of way. Twitter parade, by…
-
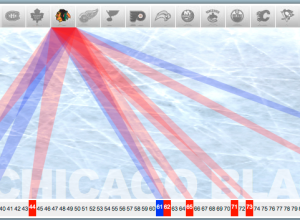
Stanley Cup winners and losers
Speaking of sports most Americans know nothing about, Robby Macdonell visualizes NHL Stanley…
-
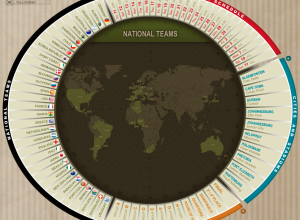
Interactive World Cup schedule
I was born in and live in the United States, so to me…
-
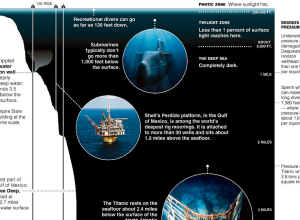
Context to underwater depths
The Deepwater Horizon well is nearly a mile deep in water. It extends…
-
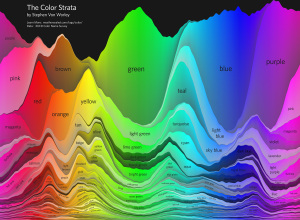
Strata of common and not so common colors
In another look at the data from xkcd’s color experiment, Stephen Von Worley…
Recently for Members
Second Edition
 Visualize This: The FlowingData Guide to Design, Visualization, and Statistics (2nd Edition)
 Visualize This: The FlowingData Guide to Design, Visualization, and Statistics (2nd Edition)
New tools, refined process.
Browse by Chart Type See All →


