There are various connections between Stephen King novels. Gillian James puts them in…
Nathan Yau
-
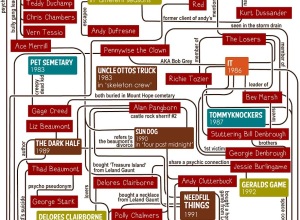
Flowchart: Connections in Stephen King novels
-
Link
Mapping Airlines →
Using world flights with ggplot2. See also.
-

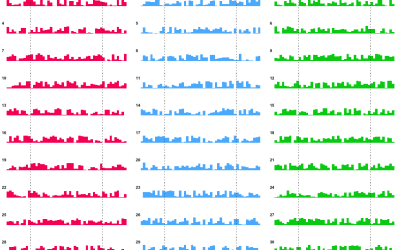
Fat and calories depicted in food pictures
You would think that fat content and calorie counts would be straightforward by…
-
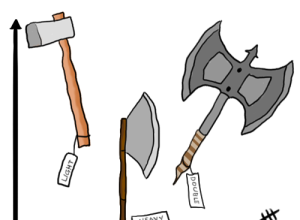
Always label your axes
From Fluffware, here’s a fine reminder to always label your axes. See, it’s…
-
Link
Padding a Time Series in R →
Script to fill in the gaps between unevenly spaced points
-
Link
Tangle →
JavaScript library for reactive documents, as seen in Bret Victor’s talk
-
Link
Clarity or Aesthetics →
Find a balance between the two
-
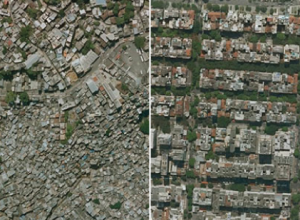
Income inequality seen in satellite images from Google Earth
Researchers Pengyu Zhua and Yaoqi Zhang noted in their 2008 paper that “the…
-
Overfishing visually explained
As part of their mission to reform destructive fishing practices, Ocean2012 explains the…
-
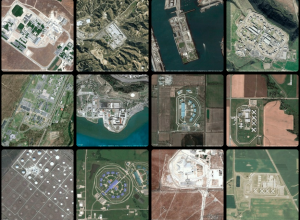
Geography of incarceration
New York University graduate student Josh Begley grabbed 4,916 satellite images of prisons…
-
Link
The Overview Effect →
Lovely set of slides by Sha Hwang on the awe from from data
-
Link
Making your R graphics look their best →
Old but all still applicable
-
Members Only
How to Draw in R and Make Custom Plots
When base graphics and existing packages don’t do it for you, turn to low-level graphics functions to make what you want.
-
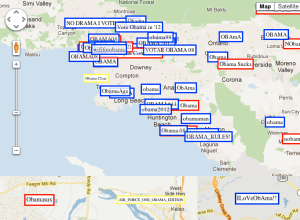
Political allegiance via wireless network SSIDs, mapped
Wireless network SSIDs in residential areas are typically left on default router names…
-
Link
Data Challenge →
New Knight News Challenge is focused on data. $5m in funding this round.
-
Link
ggplot2 blog →
Hadley Wickham started posting uses of the popular R graphics package
-
Link
Manipulating data like a boss with d3 →
Gotta get it in the right format before you visualize anything
-
Link
Bitly Data Artist →
Probably after seeing what Jer Thorp did as one at NYT, the shortlink service is out the lookout
-
Resources for Getting Started with R
R, the open source statistical software environment, is powerful but can be a…
-
Link
HTMLAPL →
jQuery plugin that associates HTML vocabulary “making it frighteningly easy to make web-native geographic maps”
Recently for Members
Second Edition
 Visualize This: The FlowingData Guide to Design, Visualization, and Statistics (2nd Edition)
 Visualize This: The FlowingData Guide to Design, Visualization, and Statistics (2nd Edition)
New tools, refined process.
Browse by Chart Type See All →


