The Census Bureau released estimates for demographic breakdowns for each county — in…
Nathan Yau
-
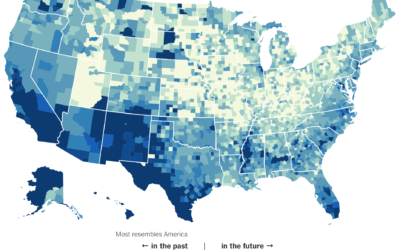
Parts of America that most resemble the future
-
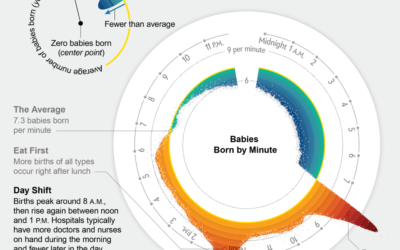
When babies are born, the cycle
Movies would have you believe that birth is random and unpredictable. (And if…
-
Email Deletion Flowchart
We all get a lot of emails, and there’s a large subset of…
-
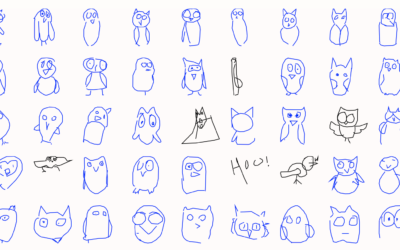
A thousand ways to draw a thing
Google released the Quick, Draw! dataset, so the closer looks at the collection…
-
A guide for using open data to combat corruption
Open Up: A Guide to Using Open Data to Combat Corruption is free…
-
Data Everywhere, Statisticians Anywhere
I had the honor to deliver the commencement speech at the UCLA Statistics…
-
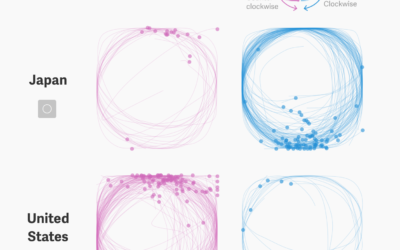
Circle drawing as an indicator for culture
Thu-Huong Ha and Nikhil Sonnad for Quartz looked at the doodling dataset from…
-

Normal coffee
This barista deserves a tip.
-
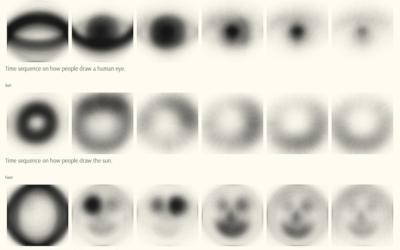
Looking for cultural expression in 50 million doodles
Using Google’s Quick Draw dataset, a collection of 50 million drawings across 345…
-
Members Only
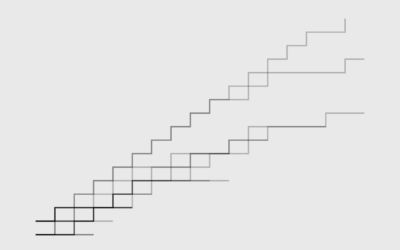
How to Make a Multi-line Step Chart in R
For the times your data represents immediate changes in value.
-
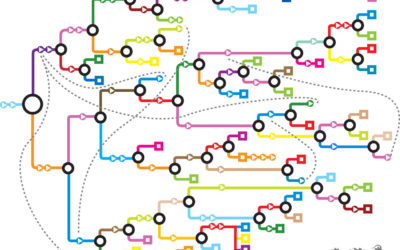
Mappings for Choose Your Own Adventure books
Every now and then there’s a visual exploration of the Choose Your Own…
-
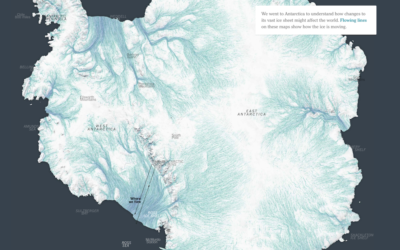
Moving ice
Ice in Antartica is in constant (very slow) motion, and as ocean waters…
-
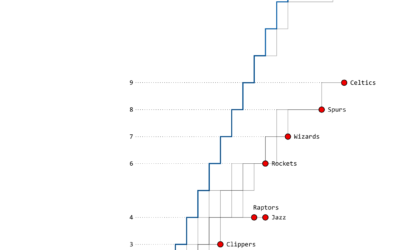
The Warriors’ Championship Path
As expected, this time, the Golden State Warriors won the championship last night.…
-
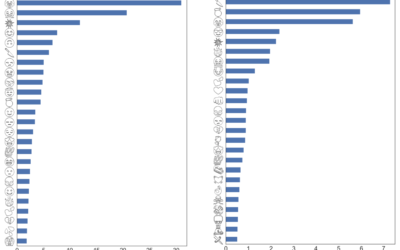
Gun emoji usage analysis
Jane Solomon collected tweets that used the gun emoji, and looked at what…
-
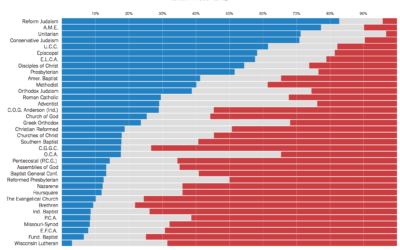
Politics of religious leaders
Kevin Quealy for The Upshot looks at political party registration of religious leaders,…
-
Members Only
Symbols-based Unit Charts to Show Counts in R
Add visual weight by using individual items to show counts.
-
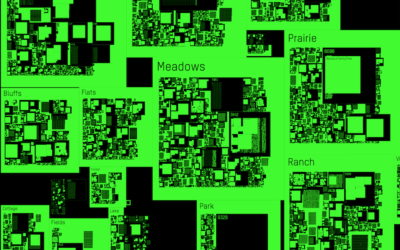
Geocities map, a snapshot of an old web
Geocities was a place on the web you could create your own space…
-
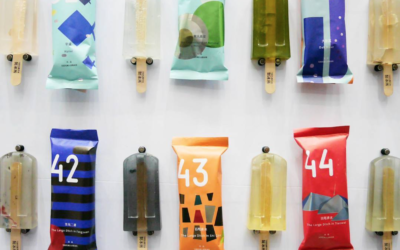
Pollution popsicles
Students at the National Taiwan University of Arts made popsicles using sewage runoff…
-
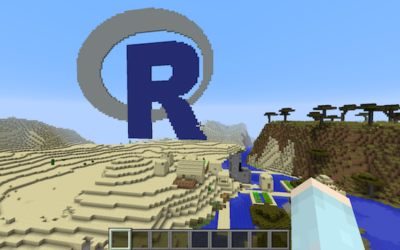
R programming with Minecraft
The new R package miner is an interface to Minecraft via some simple…
-

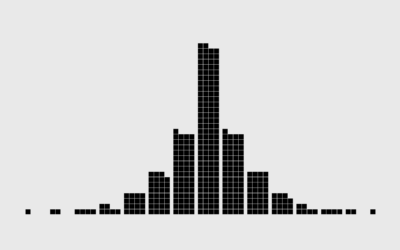
How Histograms Work
The histogram is one of my favorite basic chart types, because it lets…
Recently for Members
Second Edition
 Visualize This: The FlowingData Guide to Design, Visualization, and Statistics (2nd Edition)
 Visualize This: The FlowingData Guide to Design, Visualization, and Statistics (2nd Edition)
New tools, refined process.
Browse by Chart Type See All →


