Scientists at Harvard University setup the MEGA-plate, essentially a giant petri dish, with…
Nathan Yau
-

Watch bacteria evolve resistance to antibiotic
-

Swing states are a relatively new thing
Here’s a fun one from the Guardian. They go over the change in…
-
Election DataBot provides a feed of the interesting data stories
There is a ton of election-related data pushed out every day, so much…
-
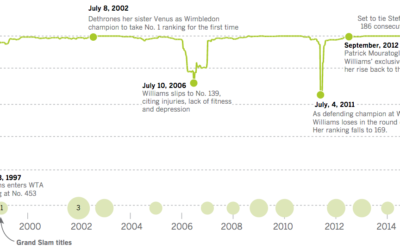
Serena Williams, greatest of all time
Serena Williams, who plays tonight in the U.S. Open semifinal, might be the…
-
Members Only
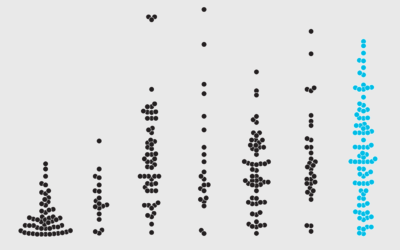
How to Make Beeswarm Plots in R to Show Distributions
Try the more element-based approach instead of your traditional histogram or boxplot.
-

Comma Chameleon, a stripped-down CSV editor
CSV files are great, but every now and then you have to edit…
-
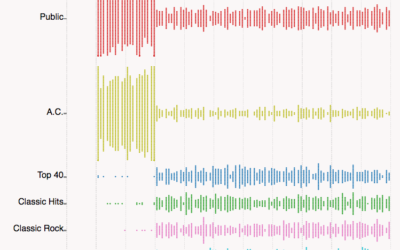
Radio station frequencies, by genre
In most areas in the United States, lower FM frequencies are reserved for…
-
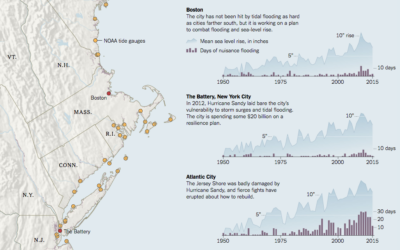
More global warming, more flooding
Water levels are rising, and naturally, the coasts are feeling it. Jonathan Corum…
-
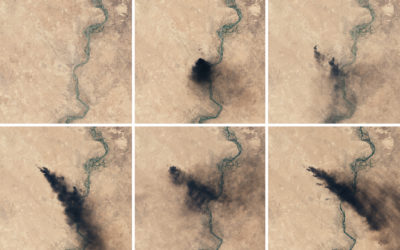
Oil fires in Iraq seen from above
Though far away, there’s still a lot you can see, as the NASA…
-

Dear Data, the book
For a year, Stefanie Posavec and Giorgia Lupi drew data postcards and sent…
-
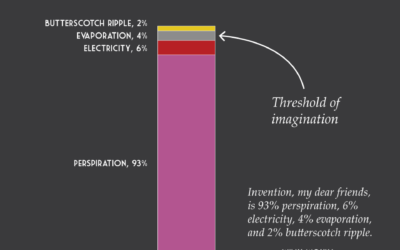
Invention
R.I.P.…
-
What Alcohol People Around the World Drink
Americans get most of their alcohol from beer, but it’s not like that everywhere.
-
Sans human, Facebook’s Trending Topics algorithm faired poorly
Last week, Facebook announced that it was making the Trending Topics section more…
-
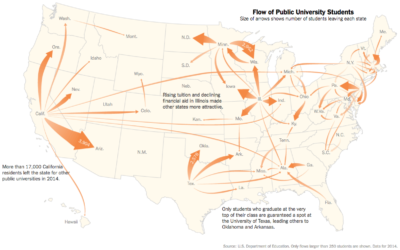
Out of state, public education
Nick Strayer for the New York Times shows the flow of college freshman…
-
D3 in Depth
D3 is the most commonly used JavaScript library for visualization on the web,…
-
Link
A Career Built on Side Projects →
My whole career is a side project.
-

This is Parenthood
Raising kids is hard to explain. I’ll try anyways. With some charts.
-

Rhyming schemes in Hamilton the musical
Hamilton is unique in its use of complex rhyming lyrics. Joel Eastwood and…
-
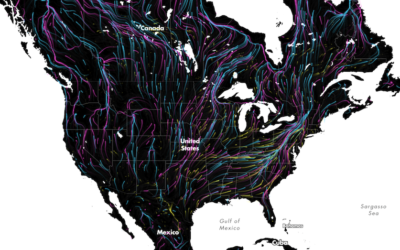
Animal migrations in animated map
The Migrations in Motion map, by Dan Majka from the The Nature Conservancy,…
-
Members Only
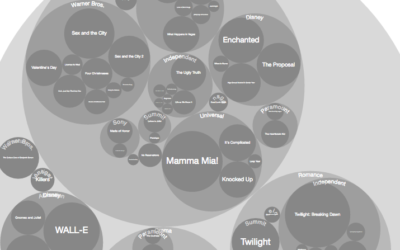
Make a Moving Bubbles Chart to Show Clustering and Distributions
Use a force-directed graph to form a collection of bubbles and move them around based on data.
Recently for Members
Second Edition
 Visualize This: The FlowingData Guide to Design, Visualization, and Statistics (2nd Edition)
 Visualize This: The FlowingData Guide to Design, Visualization, and Statistics (2nd Edition)
New tools, refined process.
Browse by Chart Type See All →


