Most Common Family Types in America
The traditional nuclear household, which is one or two parents and some kids under one roof, is an ideal many strive for. However, if television sitcoms can teach us anything it’s that the modern family structure isn’t always nuclear.
Nuclear is still the most common, but there are millions of households in the United States with a different family structure. Based on data from the 5-year American Community Survey from 2010-2014, I counted 10,276 different types of households. The graphic below shows the top 50, ordered by most common from top to bottom and left to right.
Relationships are relative to the surveyed head of household. Larger circles are (mostly) adults, and smaller circles are children or grandchildren. Circles are colored dark green to show the householder’s family nucleus, light green for family members outside the nucleus, and gray for non-relatives, which includes friends and partners. Connecting lines represent marriage and children, or the householder’s family nucleus.
I categorized the household types — one-person, nuclear, extended, or composite — using household definitions from the United Nations.
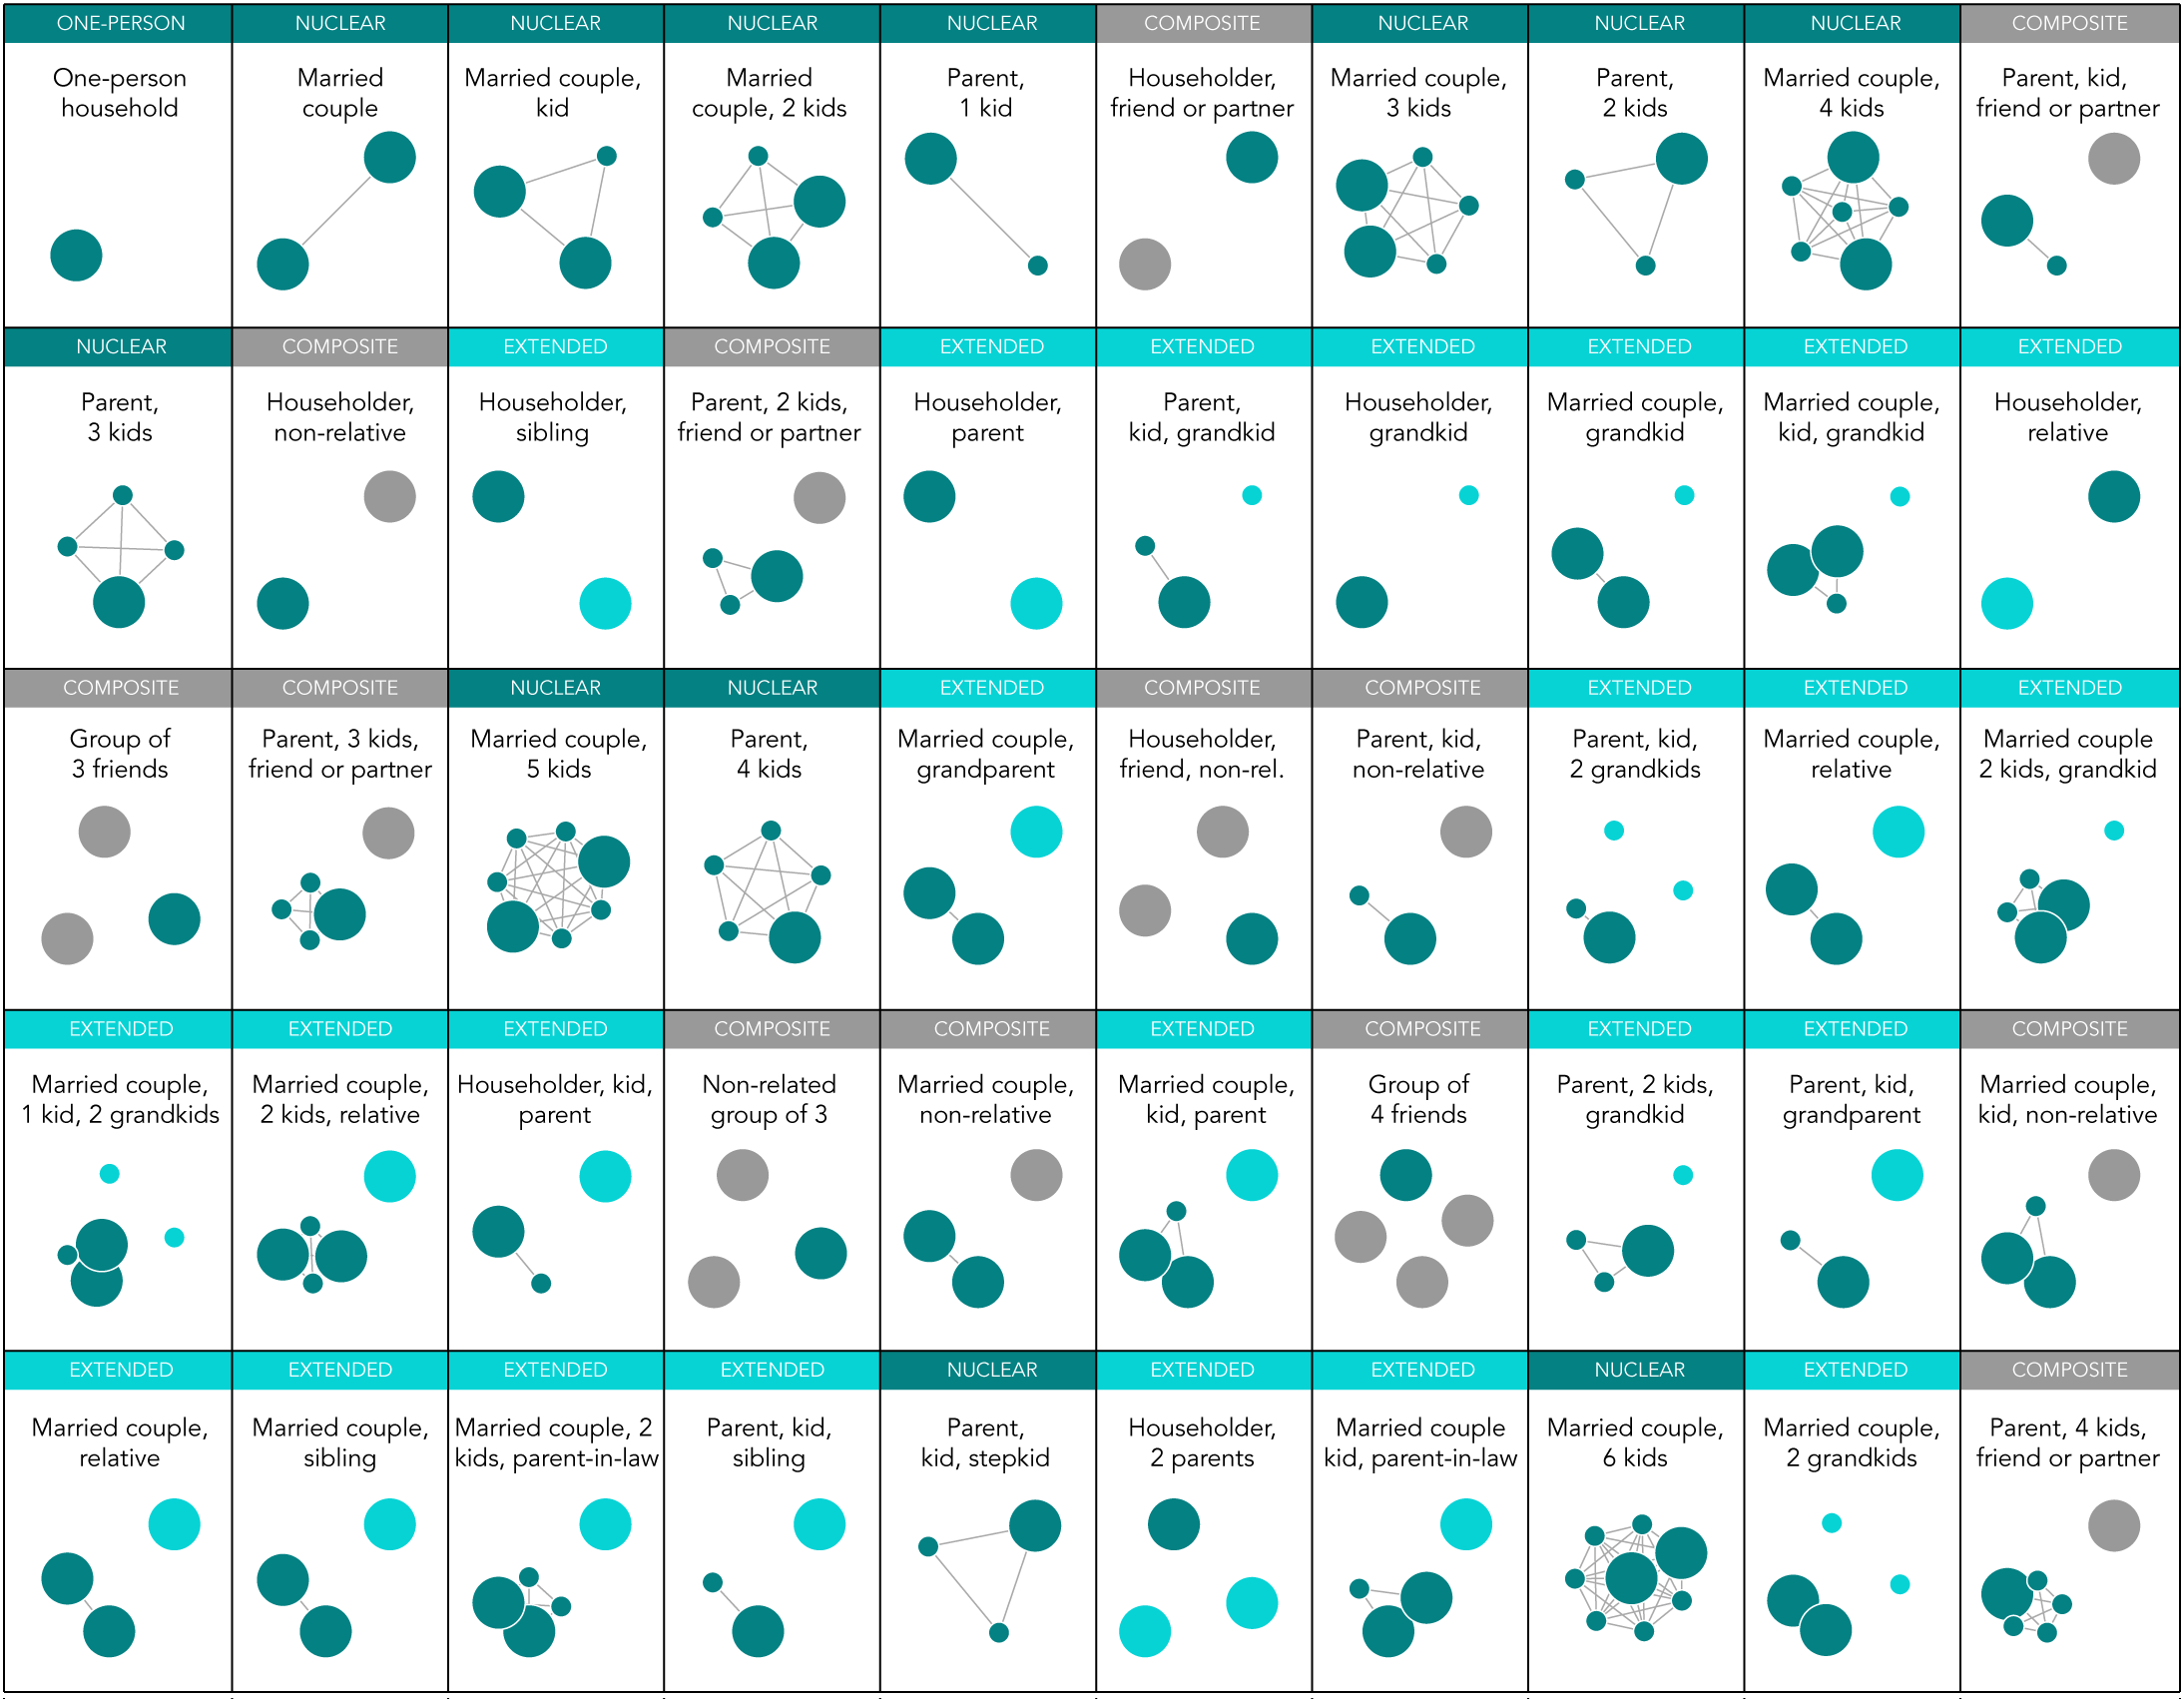
These top 50 cover about 94 percent of all household types in the United States, and as you can see there is quite the mix. But like I said, the nuclear family still dominates covering about 54 percent of households, based on ACS estimates. Then again, that leaves 46 percent of households that are not nuclear, and that seems worth looking into more deeply.
Nerd Notes
- Data comes from the 5-year, 2010-2014 American Community Survey, made more accessible by the indispensable Integrated Public Use Microdata Series maintained by the University of Minnesota.
- Some households look the same visually, such as householder/sibling and householder/parent.
- Households with a “non-relative” or “relative” didn’t fit into previous categories, so you can treat them as an “other” category.
- I used “household” and “family” sort of interchangeably here, but they’re not quite. It’s more fuzzy. Not all households, such as a group of roommates, are families. At the same time, family doesn’t always have to do with genetics.
- I used the Fruchterman-Reingold force-directed layout algorithm for each graph.
- I made this in R, edited in Adobe Illustrator, and aggregated a bit in Python.
Become a member. Support an independent site. Make great charts.
See What You GetFlowingData is made possible by supporting members. Since 2007, I, Nathan Yau, a real person, have been analyzing and visualizing data to help more people understand and appreciate it in their everyday lives.
If you liked this or want to make similar data things, please consider supporting this small corner of the internet. You get unlimited access to visualization courses, tutorials, and extra resources. Thanks. — Nathan
Chart Type Used
