What That Election Probability Means

We now have our presidential candidates, and for the next few months you get to hear about the changing probability of Hillary Clinton and Donald Trump winning the election. As of this writing, the Upshot estimates a 68% probability for Clinton and 32% for Donald Trump. FiveThirtyEight estimates 52% and 48% for Clinton and Trump, respectively. Forecasts are kind of all over the place this far out from November. Plus, the numbers aren’t especially accurate post-convention.
But the probabilities will start to converge and grow more significant.
So what does it mean when Clinton has a 68% chance of becoming president? What if there were a 90% chance that Trump wins?
Some interpret a high percentage as a landslide, which often isn’t the case with these election forecasts, and it certainly doesn’t mean the candidate with a low chance will lose. If this were the case, the Cleveland Cavaliers would not have beaten the Golden State Warriors, and I would not be sitting here hating basketball.
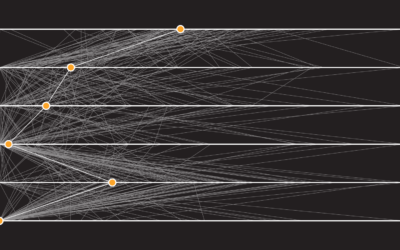
Fiddle with the probabilities in the graphic below to see what I mean.
Even when you shift the probability far left or far right, the opposing candidate still gets some wins. That doesn’t mean a forecast was wrong. That’s just randomness and uncertainty at play.
The probability estimates the percentage of times you get an outcome if you were to do something multiple times. In the case of Clinton’s 68% chance, run an election hundreds of times, and the statistical model that spit out the percentage thinks that Clinton wins about 68% of those theoretical elections. Conversely, it thinks Trump wins 32% of them.
So as we get closer to election day, even if there’s a high probability for one candidate over the other, what I’m saying is — there’s a chance.
Nerd Notes
- I’m writing this on July 27, 2016, so the probabilities on the Upshot and FiveThirtyEight are probably different by the time you’re reading this. Seriously, the numbers are all over the place right now.
- I used d3.js to make the chart using a clustered force layout. I used a similar method here and here.
Become a member. Support an independent site. Make great charts.
See What You Get