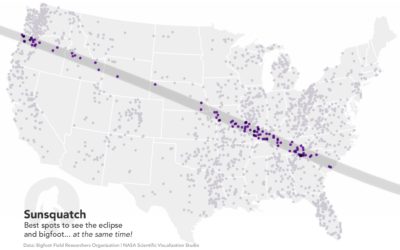
It’s solar eclipse time. There have been a lot of maps leading up…
Nathan Yau
-
Sunsquatch, the only eclipse map you need
-
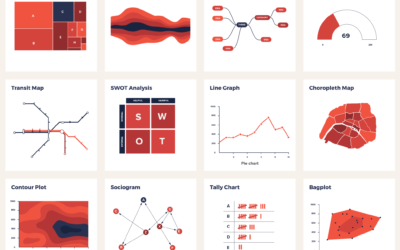
Catalog of visualization types to find the one that fits your dataset
There are a lot of visualization methods to choose from, and it can…
-
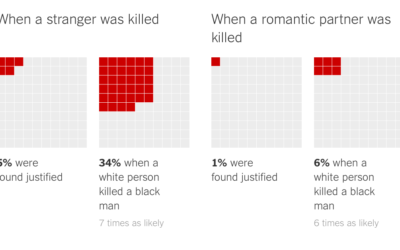
Killings of blacks by whites ruled “justified”
In a collaboration between The Marshall Project and The Upshot, Daniel Lathrop and…
-
Photorealistic balls of precious metals placed outside their mines
Artist Dillon Marsh uses CGI balls of metal placed outside of mines to…
-
Useless Data Comparisons
Apples and oranges situations where the comparisons make no sense.
-
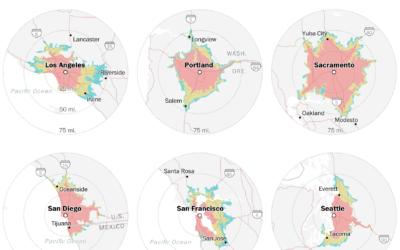
How far you can drive out of the city in one hour
Using anonymized cell phone data from Here Technologies, Sahil Chinoy for The Washington…
-
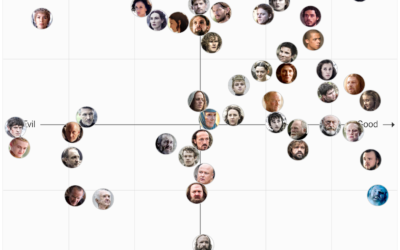
Game of Thrones character chart, you decide
I’ve never seen this Game of Thrones show, but I suspect this will…
-
Bread bag alignment chart
From @aurelianrabbit, the bread bag alignment chart. Lawful neutral, right here.…
-
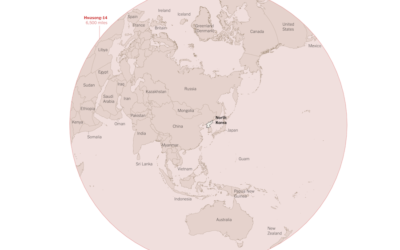
Where North Korea can reach with its missiles
Troy Griggs and Karen Yourish for The New York Times mapped the estimated…
-
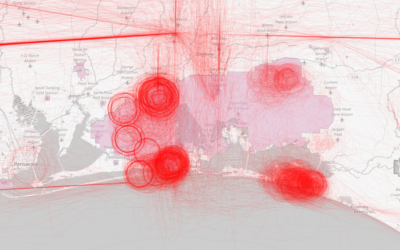
Machine learning to find spy planes
Last year, BuzzFeed News went looking for surveillance flight paths from the FBI…
-
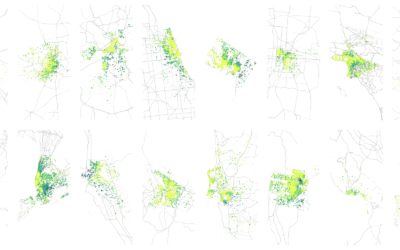
How Airbnb Visitors Rate Location in Major US Cities
This is how Airbnb visitors judge location, which provides a view into where city centers begin and end.
-
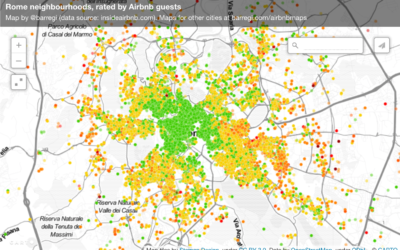
Perception of neighborhoods through Airbnb ratings
Beñat Arregi made a series of Airbnb maps with a simple premise. If…
-
Calculating the opposite of your job
Here’s a fun calculation from The Upshot.
The Labor Department keeps detailed and… -
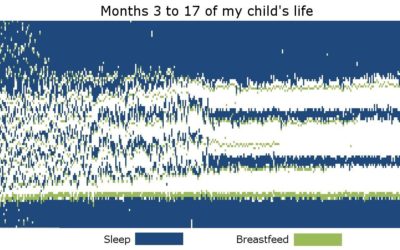
14 months of sleep and breast feeding
If you’re a parent, you’ll relate to this right away. The wife of…
-
Members Only
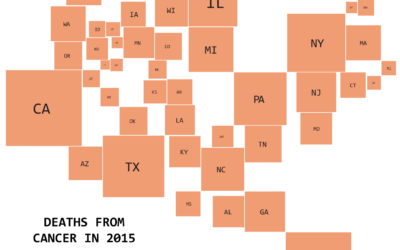
How to Make a State Grid Map in R
Something of a cross between a reference table and a map, the state grid provides equal space to each state and a semblance of the country to quickly pick out individual states.
-
Karate-inspired projection mapping
I have no idea how projection mapping works, so it kind of feels…
-
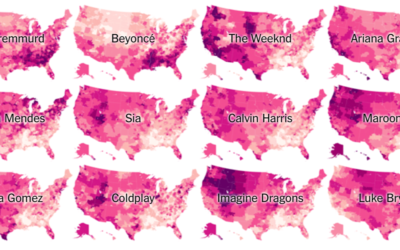
Music preference geography
Travel to different parts of the country, and you hear different types of…
-
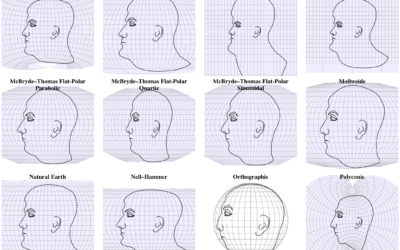
Interactive shows map projections with a face
We’ve seen faces as map projections before, but this is 63 projections on…
-
Boeing draws a plane in the sky with flight path
In a test flight, Boeing took the thing where you draw using your…
-
Link
d3-annotation 2.0 →
Next iteration of library for annotation. Made me delve into d3.js v4.







 Visualize This: The FlowingData Guide to Design, Visualization, and Statistics (2nd Edition)


