Also known as a Marimekko diagram, the mosaic plot lets you compare multiple qualitative variables at once. They can be useful, sometimes.
Nathan Yau
-
Members Only
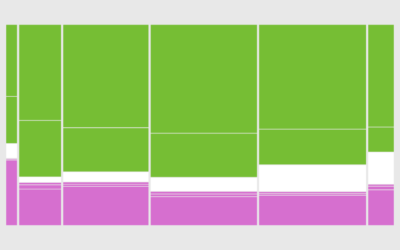
How to Make a Mosaic Plot in R
-
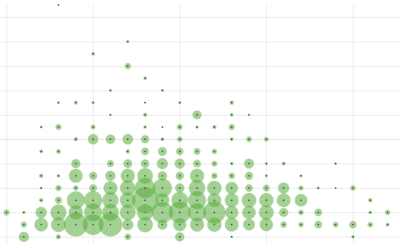
After Marriage, How Long People Wait to Have Kids
First comes love, then comes marriage, then comes baby in the baby carriage. Sometimes.
-
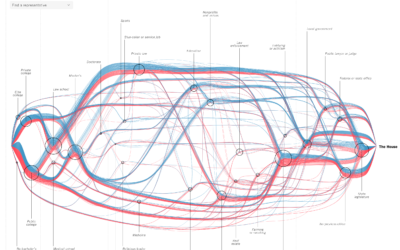
See every member’s path to the House of Representatives
For The New York Times, Sahil Chinoy and Jessia Ma visualized the path…
-
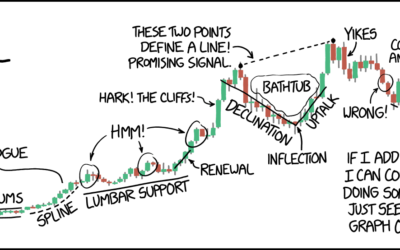
xkcd: technical analysis
Seems about right.…
-
Baby-Making Age
We looked at prime dating age and when people usually marry. Now it’s time for the next step in the circle of life.
-
Members Only

Where to Find Data to Drive Your Visualization
Unfortunately, you can’t just conjure data out of thin air. Well, I guess you can, but it’d probably be sort of unreliable. Kind of. Maybe. So where do you find data? Here’s where I’m at in 2019.
-
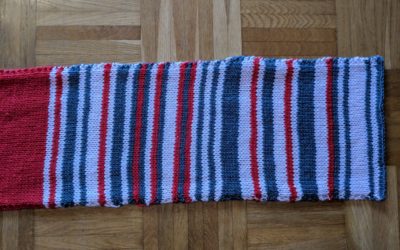
Rail delay scarf goes for $8,500 on eBay
Sarah Weber posted a picture of a scarf that her mom knit to…
-

Scale of tens
I’m always up for some scaled perspective. From David Packer:
Anyone need a…
-
DataKind receives $20M grant to expand on data for social good
DataKind, the organization known for helping others use data for social good, received…
-
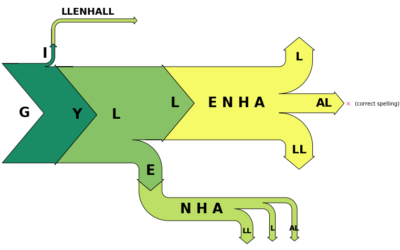
Looking for common misspellings
Some words are harder to spell than others, and on the internet, sometimes…
-
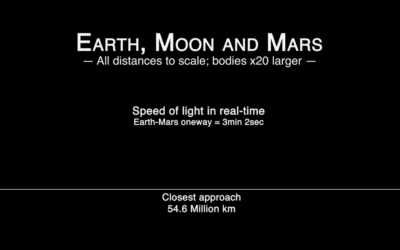
Real-time speed of light from Earth to Mars
Hurry up, light. We’re gonna be late:
By James O’Donoghue, the animation shows… -
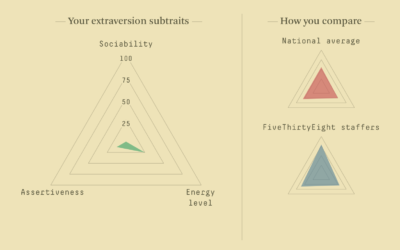
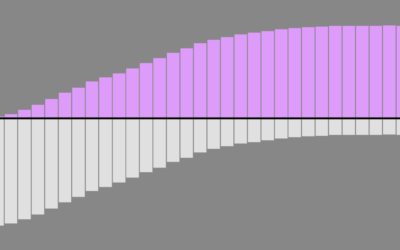
Personality quiz with traits on a spectrum
Ah, the online personality quiz, oh how I missed you. Oh wait, this…
-
Members Only
Datawrapper Review: A Focused Charting Tool That Requires No Code
Datawrapper is an online tool that helps you make nice-looking charts for the web. No code is required. Instead, a focused interface lets you load data, pick your chart type, refine, and publish.
-

Inside out map of the Grand Canyon
John Nelson turned the Grand Canyon inside out to understand the magnitude better:…
-

Build a parasite to block your digital assistant
Digital assistants offer convenience, but they also offer continuous surveillance, and it’s not…
-
Amanda Cox promoted to New York Times data editor
Amanda Cox is the new data editor for The New York Times:
As… -
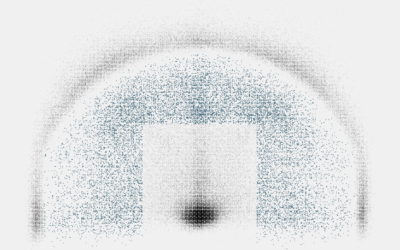
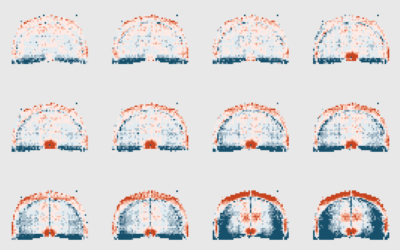
Goodbye, Mid-Range Shot
There’s a space on the basketball court called “mid-range.” It’s actually not off-limits. In fact, people used to shoot these so-called “mid-range” shots.
-
Members Only
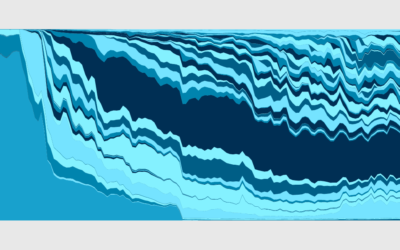
How to Make Animated (GIF) Heatmaps in R
Using color as the visual encoding, show changes over time in two dimensions.
-
When geolocation makes everyone think you stole their phone
People show up unannounced at John and his mother Ann’s home in South…
-
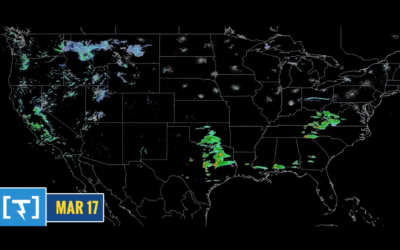
One-year time-lapse of the weather
Along the same lines as last week’s one-year wind time-lapse, Weather Decoded provides…
Recently for Members
Second Edition
 Visualize This: The FlowingData Guide to Design, Visualization, and Statistics (2nd Edition)
 Visualize This: The FlowingData Guide to Design, Visualization, and Statistics (2nd Edition)
New tools, refined process.
Browse by Chart Type See All →


