Our World in Data is a hub for research and reliable data to…
Data Sources
Have fun and play with some numbers.
-
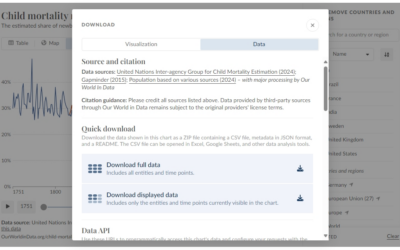
Our World in Data wants you to use their data with improved export and API
-
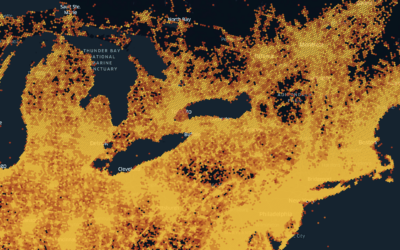
Foursquare open sources location data
Foursquare, which I thought was still a location sharing app but is a…
-
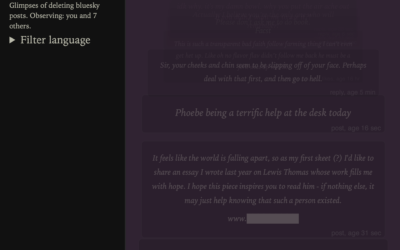
Stream of deleted Bluesky posts
To demonstrate how easy and cheap it is to access the Bluesky firehose,…
-

WildChat, a dataset of ChatGPT interactions
In case you need a large dataset to train your chatbot — and…
-
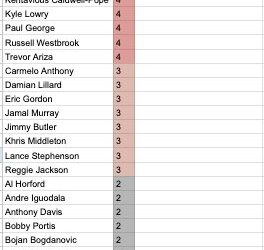
Collection of NBA basketball data sources and apps
If you’re into basketball data, Sravan Pannala is keeping a running list of…
-
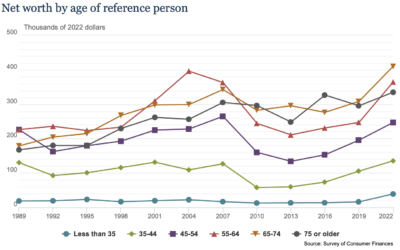
Data on net worth, income, and savings
Data for the 2022 Survey of Consumer Finances, from the Federal Reserve Board,…
-
When Mike Breen announces “Bang!”
Mike Breen is a well-known NBA basketball announcer. When a player hits a…
-
Tattoos and impulsiveness dataset
For their research on tattoos and choice, Bradley Ruffle and Anne Wilson provide…
-

Guide for working with machine learning datasets
As part of the Knowing Machines research project, A Critical Field Guide for…
-

Database of feathers
There’s a database of feathers called Featherbase, because of course there is:
Featherbase… -
Scraping public data ruled legal
For TechCrunch, Zack Whittaker reporting:
In its second ruling on Monday, the Ninth… -
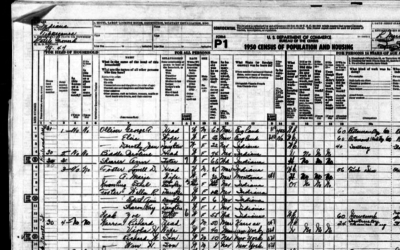
1950 Census released by U.S. National Archives
For privacy reasons, there’s a 72-year restriction on individual Census records, which include…
-
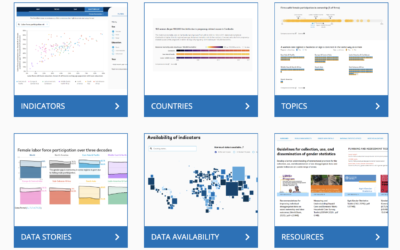
World Bank’s Gender Data Portal
In an effort to make gender inequalities more obvious, World Bank updated their…
-
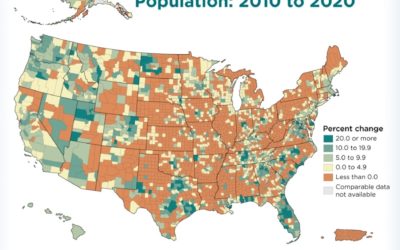
More detailed data release from Census 2020
After a lot of angst over the past few years around undercount, representation,…
-

Money-in-politics nonprofits merge their datasets
Center for Responsive Politics and National Institute on Money in Politics are merging…
-

Mining Parler data
Just before the social network Parler went down, a researcher who goes by…
-
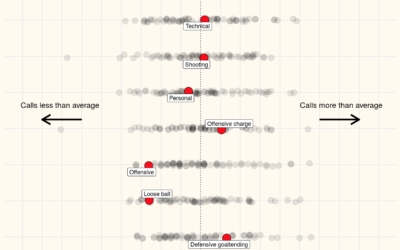
Data for all of the referee calls in NBA games
Owen Phillips compiled per game and cumulative foul calls for all NBA referees…
-
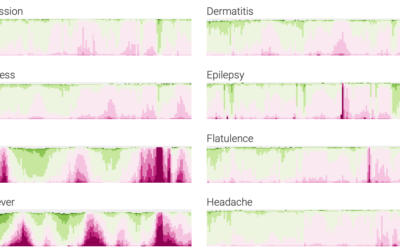
Google search trends dataset for Covid-19 symptoms
Google released a search trends dataset earlier this month. Using this dataset, Adam…
-
Friends sitcom transcript dataset
For your analytical perusal, Emil Hvitfeldt provides ten seasons’ worth of scripts from…
-
Data on loans issued through the Paycheck Protection Program
The Paycheck Protection Program was established to provide aid to small businesses. It’s…
Recently for Members
Second Edition
 Visualize This: The FlowingData Guide to Design, Visualization, and Statistics (2nd Edition)
 Visualize This: The FlowingData Guide to Design, Visualization, and Statistics (2nd Edition)
New tools, refined process.
Browse by Chart Type See All →


