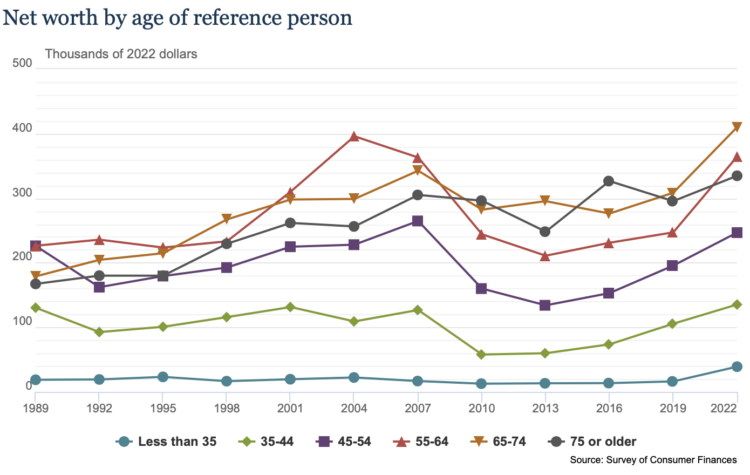
Data for the 2022 Survey of Consumer Finances, from the Federal Reserve Board, was made available recently. It comes out every three years, so you can see how income and savings have changed over time, broken down by demographics.
For example, the above shows that net worth increased, across age groups, since the last release in 2019. The chart is from the SCF’s “chartbook,” which isn’t the most elegant thing in the world, but it works.
 Visualize This: The FlowingData Guide to Design, Visualization, and Statistics (2nd Edition)