It seems like ages since we ran one of these.
It’s hard to…
Contests
You can’t win if you never try.
-
Comment to win a signed copy of Data Points
-
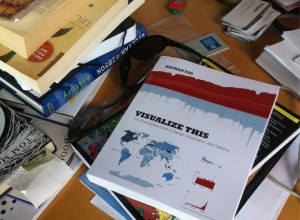
Send your pictures of Visualize This in the wild (and win a goodie)
One of the best parts since the launch of Visualize This has been…
-

Challenge: Visualize the impact of Wikipedia
If you’re like me, you’ve probably used Wikipedia at least once in the…
-

Visualization contests around the corner
The best way to learn how to visualize data is to grab a…
-
Friday freebies: Comment to win a copy of R Cookbook – winners announced
Want a free copy of R Cookbook by Paul Teetor? You’re in luck,…
-
Comment to win a free HistoryShots print – winners announced
Happy Friday, everyone. Leading into the weekend, HistoryShots has kindly put three prints…
-
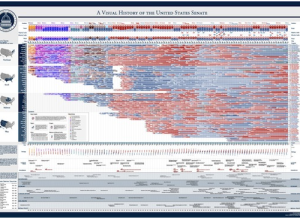
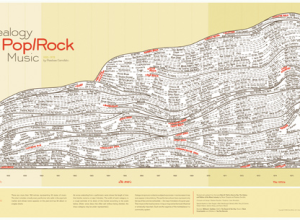
Friday freebies: Visual history posters from Timeplots – winners announced
It’s Friday, and the weekend’s staring you in the face. You look like…
-
Comment to win free registration for Strata data conference – winner announced
Okay, I sort of dropped the ball on this one. I have a…
-
Comment to win a copy of Data Analysis with Open Source Tools – winner announced
Looking to get more serious about your data analysis? Data Analysis with Open…
-
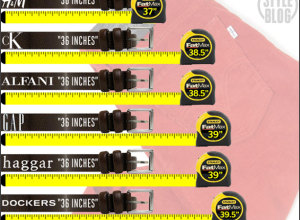
Challenge: Advertised vs. actual waistline
Ever notice how pants seem to fit differently from store-to-store even though they’re…
-
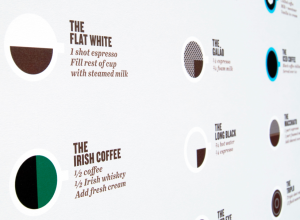
Comment to win a graphic guide to coffee drinks (poster) – winner announced
We saw this handy dandy coffee guide by Plaid Creative a while back.…
-
Comment to win a copy of ‘Beautiful Visualization’ – winner announced!
Continuing with the ‘Beautiful’ series, O’Reilly has released their newest one, Beautiful Visualization.…
-
Comment to win free copies of ‘Beginning Python Visualization’ – Winners announced
You know when you’re going through old junk and find something really awesome…
-
Comment to win free copies of The Visual Miscellaneum: Winners announced!
As we all know, David McCandless of Information is Beautiful, launched his new…
-
Friday Freebies: 5 Copies of Applied Security Visualization
We passed the 20k-subscriber mark last week. Very cool, and a tiny bit…
-
Friday Freebies: Beautiful Data is Now Available
Beautiful Data from O’Reilly is now available! The book is a collection of…
-
Friday Freebies: 5 E-book Copies of Beginning Python Visualization
It’s Friday! I don’t know about you, but I’m ready for the weekend,…
-
Friday Freebies: 1,000 Business Cards from AllBusinessCards
The folks over at AllBusinessCards have generously donated 1,000 business cards to three…
-
FlowingData NCAA Tournament Bracket – Try and Beat Me
I just started the FlowingData NCAA tournament bracket. Join now. Try and beat…
-
Phew, FlowingData 10k Giveaway is Done!
Our 10k giveaway is now complete. Congratulations to all the winners, and a…
Recently for Members
Second Edition
 Visualize This: The FlowingData Guide to Design, Visualization, and Statistics (2nd Edition)
 Visualize This: The FlowingData Guide to Design, Visualization, and Statistics (2nd Edition)
New tools, refined process.
Browse by Chart Type See All →


