Choice of color in a movie can say a lot about what's going on in a scene. It sets the mood, changes the tone, indicates a change in point of view, so on and so forth, which is why moviebarcode is so fun to click through. The concept is simple. Take every frame in a movie and compress it into a sliver, and put them next to each other. Voilá. Movie barcode.
Continue Reading
2011 March
-
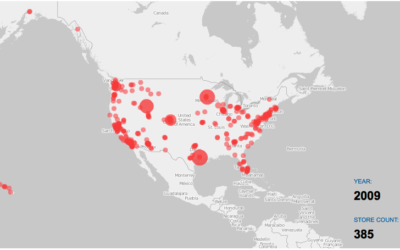
Watching the growth of Costco warehouses
Costco is one of the best stores ever. It's got everything you need in gigantic volumes and more, so you... -
Review: Beautiful Visualization – Looking at Data through the Eyes of Experts
I finally got a chance to take a closer look at O'Reilly's most recent edition to their "Beautiful" series, Beautiful... -
Entire movies compressed into single barcodes
-
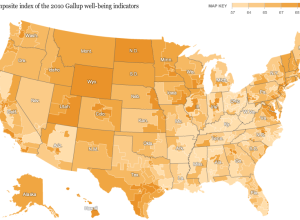
Well-being of the nation mapped
Analyzing Facebook and Twitter updates to gauge happiness is all the rage these days, but Gallup has been doing it old school for the past three years. Every day, Gallup has called 1,000 randomly selected American adults and asked them a series of questions about their well-being such as, "Did you experience feelings of happiness during a lot of the day yesterday?" and "Do you smoke?"
Matthew Bloch and Bill Marsh for the New York Times mapped the responses for the past calendar year. Use the browser to quickly compare well-being in your area and across the country.
Continue Reading -
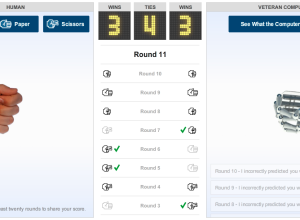
Test your Rock-Paper-Scissors strategy against the machine
We learned the strategy to win Rock-Paper-Scissors every time, but does it really work? For the New York Times, Gabriel Dance and Tom Jackson give you your chance:
Computers mimic human reasoning by building on simple rules and statistical averages. Test your strategy against the computer in this rock-paper-scissors game illustrating basic artificial intelligence. Choose from two different modes: novice, where the computer learns to play from scratch, and veteran, where the computer pits over 200,000 rounds of previous experience against you.
Be sure to play at least five rounds, and then click on the button to see what the computer is thinking. In veteran mode, the computer searches its database for sequences that match your last five moves and its last five moves and then tries to predict what you'll throw next.
Are you good enough to beat the basic artificial intelligence?
-
Best of FlowingData – February 2011
February was a good month. We continue to inch closer towards the 50k-subscriber mark, and traffic-wise we're nearing that coveted 1M pageviews in a single month. It hasn't happened yet, but I think it's going to happen soon, thanks much in part to all of you.
In case you missed these, here are the most popular posts from the past couple of months:
- Hey Jude flowchart
- Map of scientific collaboration between researchers
- What your state is the worst at - United States of shame
- How Starbucks' new Trenta compares to your stomach
- Map of North American English dialects and subdialects
- Where people swear in the United States
- A visual guide to eggs
- Charted guide to fancy drinks
- State of Wikipedia, 10 years later
- Map: United States of surnames
Thanks again for reading and sharing. Every tweet and like helps FD reach a wider audience, so please keep doing it (or doing it more :).
-
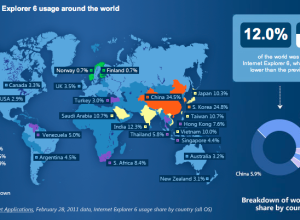
Countdown to the end of Internet Explorer 6
If you've ever designed for the Web, you know what a pain it is to get your work to look right in Internet Explorer 6. It's outdated, and it's not standards compliant, so a design that looks good in Firefox, Chrome, or Safari might look horrible in IE6 (and subsequent versions for that matter). The good news is that Microsoft has started the countdown to the end with a map that shows IE6 browser share around the world. Twelve percent of the world still uses the browser as of February 2011, with a big chunk of that from China.
[Internet Explorer Countdown | via @mericson]
-
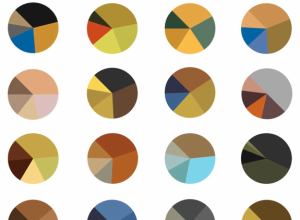
Vincent van Gogh paintings as pie charts
Arthur Buxton breaks down van Gogh paintings for a view of color schemes. My instincts tell me you are either loving this or hating it like the black plague.
[Arthur Buxton via Flavorwire | Thanks, Elise]
-
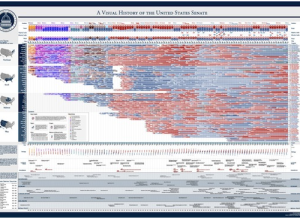
Friday freebies: Visual history posters from Timeplots – winners announced
It's Friday, and the weekend's staring you in the face. You look like you need some free stuff. Timeplots has kindly put up three visual history prints up for grabs. In case you're not familiar, Timeplots takes complex history stories, like the American presidency or the changing nature of the Senate, and puts them in visual form.
Continue Reading -
Most typical person in the world
Continuing their series on world population, National Geographic focuses in on the "most typical" person in the world. The above image is an artist's rendering of the average face computed by the Chinese Academy of Sciences in Beijing. Zoom in and you'll see that the face is made of 7,000 human figures, as shown below. It's true. I counted.
Continue Reading -
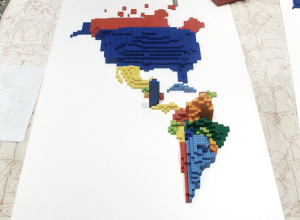
Lego cartograms show immigration and migration
LEGOs were my favorite toy growing up. This was back when the pieces came in buckets rather than the instruction-filled Star Wars sets that we see nowadays, so it was more about building whatever popped into your head. Good memories. In any case, Samuel Granados took a big ol' bucket of LEGOs and made some cartograms showing immigration and emigration in the Americas. Each piece represents 10,000 people.
Continue Reading -
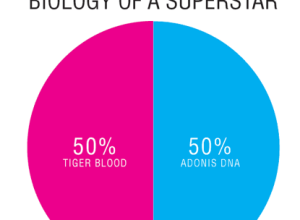
Tiger blood and adonis DNA
There are no words. More tips on winning in the world found here.
-
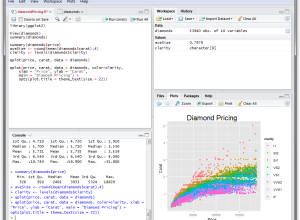
RStudio: a new IDE for R that makes coding easier
I tweeted this out earlier, but people are really excited about RStudio, an integrated development environment (IDE) that has the potential to make R coding and development a whole lot easier.
Continue Reading -
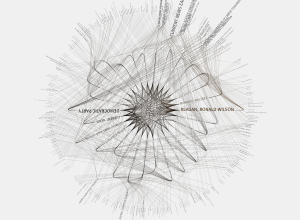
German defense minister’s plagiarized PhD dissertation visualized
As some of you might know, Germany's defense minister, Karl-Theodor zu Guttenberg, resigned yesterday after admitting that he plagiarized his PhD dissertation. Pitiful, I know.
Gregor Aisch visualized Guttenberg's dissertation, highlighting the plagiarized portions. The dark red represents complete or masked plagiarism, while the lighter red represents different categories of plagiarism. Longer bars are for normal text, and small bars represent footnote lines. Not sure why there seems to be as much footnote as there is normal text.
In any case, at least Guttenberg wrote some of it. But still sad.
[vis4]
-
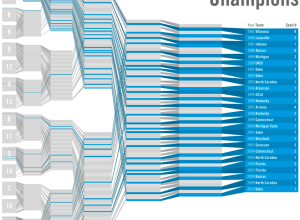
March Madness bracketology – winners and losers
Working off last year's bracketology graphic, Leonardo Aranda took a simpler approach in showing all the winners and losers from the NCAA tournament from 1985 to present. Each line represents a team (not a school), and championship winners are highlighted blue, so what you get is a quick view of the paths past winners have taken. No schools ranked lower than eight have ever win, and most winners have been seeded in the top three.
I like this version better than last year's. The sorting is a lot easier to read and understand. What do you think?
[yonoleo | Thanks, Leonardo]
-
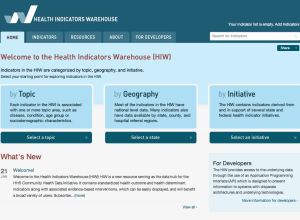
Lots of health data released via Health Indicators Warehouse
The government has been making a big push for more open health-related data, and a couple of weeks ago, they released a whole bunch of it with the launch of HealthData.gov. It's the same interface as Data.gov, but for health. Additionally, the Health Indicators Warehouse launched with different data and a slightly more useable interface.
A quick scan of the data available, however, does seem to indicate that a lot of it is spotty or outdated (like on data.gov), which doesn't make it especially useful. For example, some data sets are only one data point, while others are only a single year. At least it's a start.
-
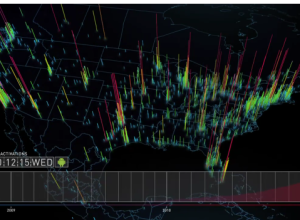
Global Android activations mapped and animated
iPhone gets all the glory, but there are plenty of Android phones activated every day, worldwide. This quick visualization (below), from the Android Developers themselves, shows just how that growth has gone over the past few years. It starts with a worldwide view and then zooms in on countries for a closer look. Keep an eye on the top left corner for phone launches.
Continue Reading


The Best Data Visualization Projects of 2011
What Facebook knows about you
Where are the biggest box office movies (not) streaming?
High-resolution maps of science
Backbone of the flavor network
Vehicles involved in fatal crashes
Cinemetrics creates a visual fingerprint for movies
Visualize This