For the Washington Post, Taylor Telford, Jaclyn Peiser, and Federica Cocco report on…
unemployment
-
Getting more difficult to find a job
-
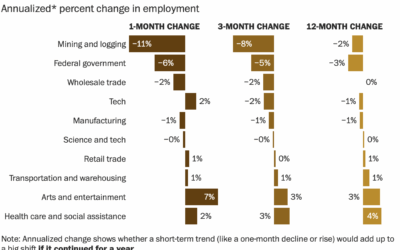
Unemployment and Occupation
Unemployment has hit some industries more than others. Here’s how the most recent estimates compare against last year’s.
-
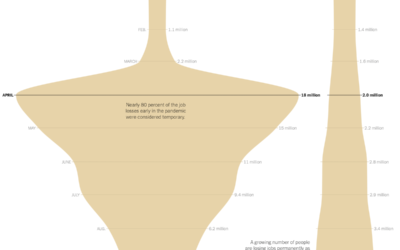
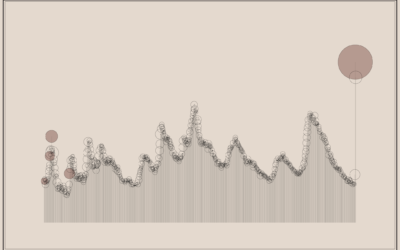
Shape of unemployment
For The New York Times, Ella Koeze looks at the various types of…
-
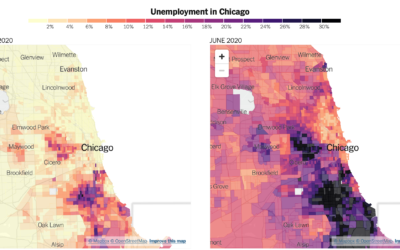
Distribution of unemployment at the tract level
We’ve been hearing a lot about national unemployment rate, but it’s not uniformly…
-
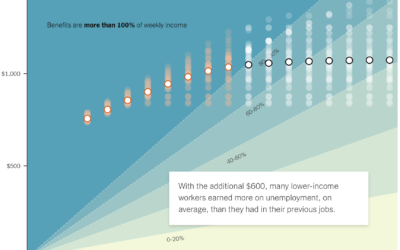
If the unemployed lose $600 per week
A $600 per week benefit expires for the unemployed at the end of…
-
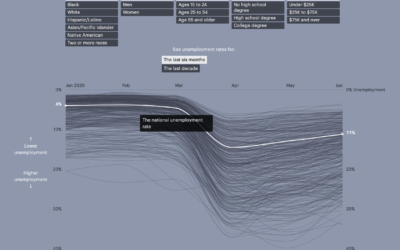
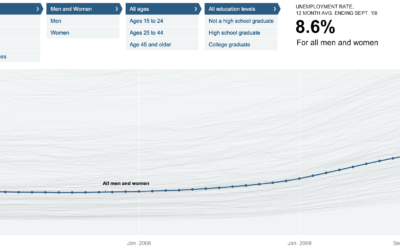
Unemployment for different groups
Unemployment has hit the United States hard over the past several months, for…
-
Unemployment Rate Changes
In April 2020, the Bureau of Labor Statistics estimated a national unemployment rate of 14.7%. It wasn’t just the rate itself but how fast it spiked.
-
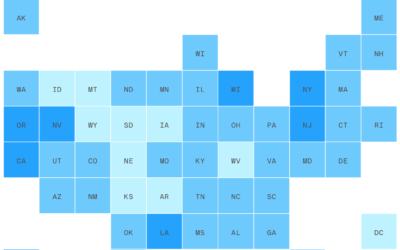
Households that lost income
This straightforward grid map by Danielle Alberti for Axios shows the percentage of…
-
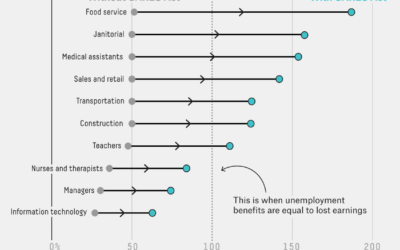
Where unemployment benefits are higher than lost wages
Economists at the University of Chicago analyzed unemployment benefits from the CARES act…
-
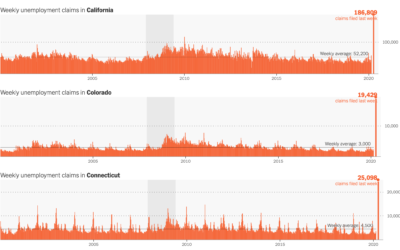
Unemployment spike
The Department of Labor released the numbers for last week’s unemployment filings. 3.28…
-
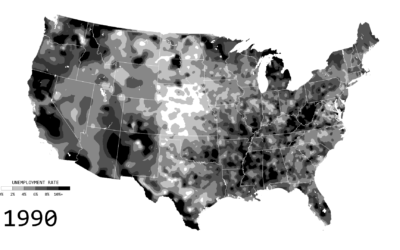
Unemployment in America, Mapped Over Time
Watch the regional changes across the country from 1990 to 2016.
-
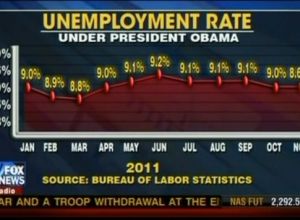
Fox News still makes awesome charts
Charts and graphs are great, because they can let you see a pattern…
-
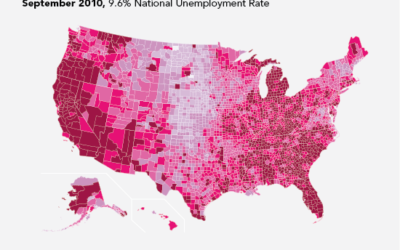
Unemployment rates over this past year
I took a look at unemployment rates about a year ago, and I…
-
Unemployment Rate For People Like You – NYT Interactive
Shan Carter, Amanda Cox, and Kevin Quealy of The New York Times explore…


 Visualize This: The FlowingData Guide to Design, Visualization, and Statistics (2nd Edition)


