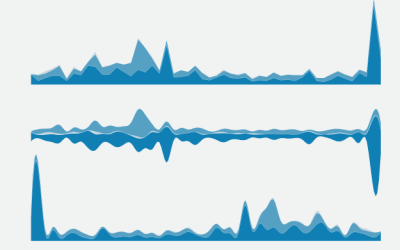
Adam Pearce for the New York Times charted ad spending for Clinton and…
streamgraph
-
Ad spending for Clinton and Trump
-
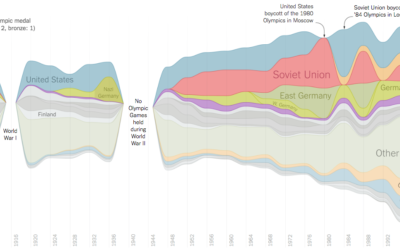
Streamgraph of Olympic medal wins
Gregor Aisch and Larry Buchanan for the New York Times visualized Olympic medal…
-
Members Only
How to Make Stacked Area Charts in R
From the basic area chart, to the stacked version, to the streamgraph, the geometry is similar. Once you know how to do one, you can do them all.
-
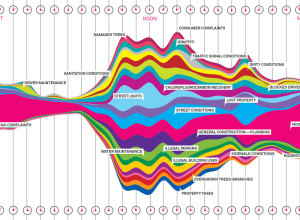
What New Yorkers complain about
Wired, in collaboration with Pitch Interactive, has a look at complaints called in…


 Visualize This: The FlowingData Guide to Design, Visualization, and Statistics (2nd Edition)


