Neal Agarwal is up to his wonderful ridiculousness again. Imagining an elevator that…
scrollytelling
-
An illustrated tour of the skies in an elevator
-
Scrolly video JavaScript library
ScrollyVideo.js is a JavaScript library that makes it easier to incorporate videos in…
-
Shifting currents and melting ice in the Antarctic
Based on data from autonomous sensors floating in the oceans, researchers are able…
-
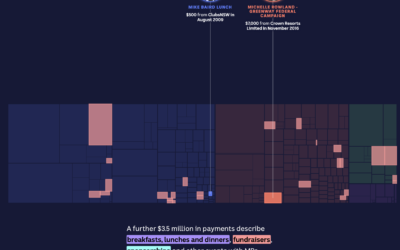
Treemap tour of political donations
The Digital Story Innovation Team for ABC News in Australia looked at political…
-
Collapse of Mexico City Metro explained
The New York Times investigated the collapse of the Metro, which killed 26…
-
An atlas for the world’s development indicators
The World Bank tracks global development through a number of indicators. (You can…
-
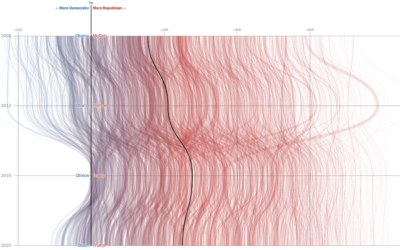
Red counties mostly stayed red
For The New York Times, Denise Lu and Karen Yourish looked at the…
-
Maps of Home
Dots on a map can feel like, well, just a bunch of dots.…
-
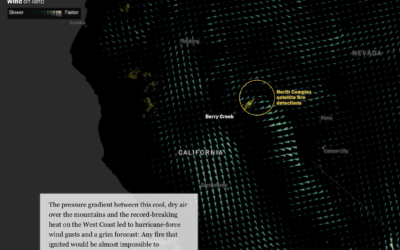
Fires in the west and climate change
This is some advanced mapping and scrollytelling from the Washington Post. The piece…
-
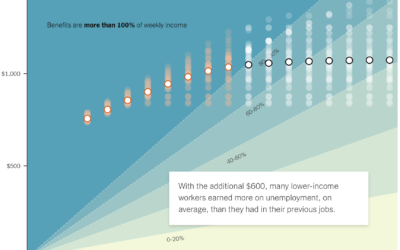
If the unemployed lose $600 per week
A $600 per week benefit expires for the unemployed at the end of…
-
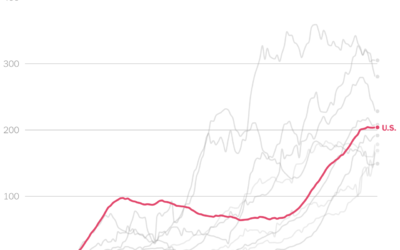
Comparing U.S. coronavirus case rates to other hot spots
The numbers are high here in the United States, and at this point,…
-
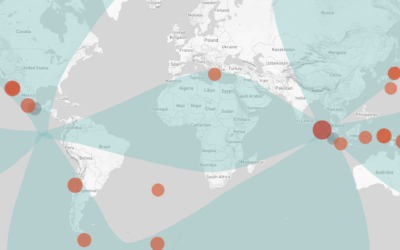
How an earthquake can trigger others on the opposite side of the world
Speaking of earthquakes, Will Chase looked back at a 2012 earthquake in Sumatra…
-
Visual introduction to bias in machine learning
A few years ago, Stephanie Yee and Tony Chu explained the introductory facets…
-
Stopping a nuclear missile fired at the US
I hate that this feels like something civilians should know. Bonnie Berkowitz and…
-
Scrollama.js, a JavaScript library for scrollytelling
Russell Goldenberg released Scrollama.js in an effort to make scrollytelling more straightforward to…
-
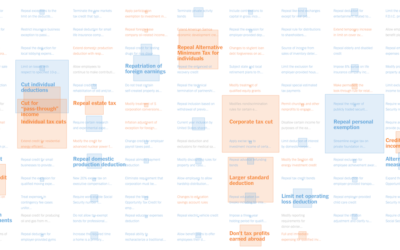
Every tax cut and increase in House Republicans’ bill
The House Republicans will vote on a tax bill soon that adds about…
-
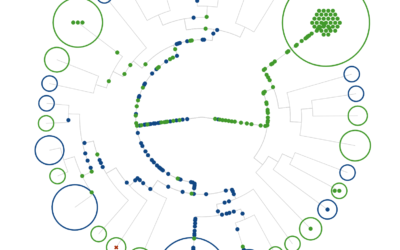
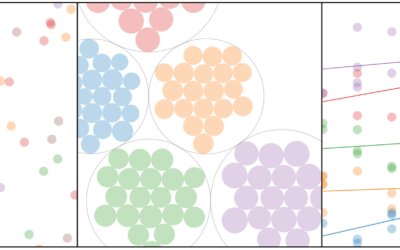
Visual explainer for hierarchical modeling
Hierarchical models, or multilevel models, are used to represent data that might vary…
-
Link
How to implement scrollytelling with six different libraries →
A brief look at six libraries to make your charts move as you scroll.








 Visualize This: The FlowingData Guide to Design, Visualization, and Statistics (2nd Edition)


