Oftentimes, you’ll want to fit a line to a bunch of data points. This tutorial will show you how to do that quickly and easily using open-source software, R.
R
-
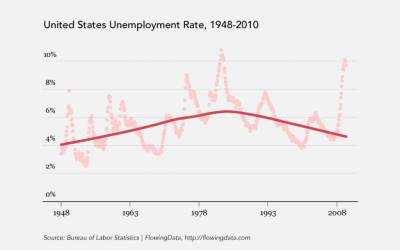
How to: make a scatterplot with a smooth fitted line
-
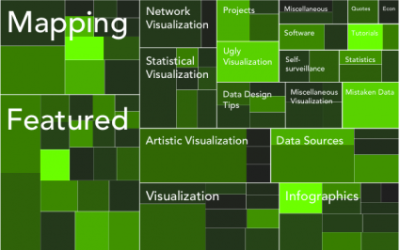
An Easy Way to Make a Treemap
If your data is a hierarchy, a treemap is a good way to show all the values at once and keep the structure in the visual. This is a quick way to make a treemap in R.
-
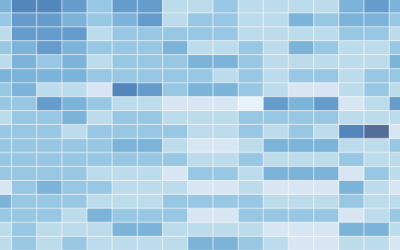
How to Make a Heatmap – a Quick and Easy Solution
A heatmap is a literal way of visualizing a table of numbers, where you substitute the numbers with colored cells. This is a quick way to make one in R.
Recently for Members
Second Edition
 Visualize This: The FlowingData Guide to Design, Visualization, and Statistics (2nd Edition)
 Visualize This: The FlowingData Guide to Design, Visualization, and Statistics (2nd Edition)
New tools, refined process.
Browse by Chart Type See All →


