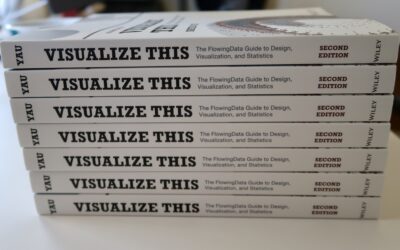
The second edition of Visualize This is published. The book made its way…
learning
-
Visualize This: Publication Day, Fourteen Years Later
-
Birding and data visualization
Jer Thorp has combined birding and data visualization into a unique course called…
-
Steps for getting started with data visualization
Getting started with data visualization can be tricky because of all the resources…
-
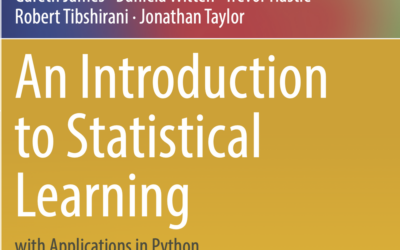
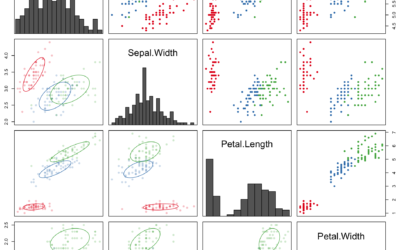
Introduction to statistical learning, with Python examples
An Introduction to Statistical Learning, with Applications in R by Gareth James, Daniela…
-
Members Only
Unrestricted Visualization
It’s nice that visualization has developed over the years to the point that there are dedicated classes for it, but I also like learning informally.
-
Introduction to statistical learning
An Introduction to Statistical Learning, by Gareth James, Daniela Witten, Trevor Hastie, and…
-
Members Only
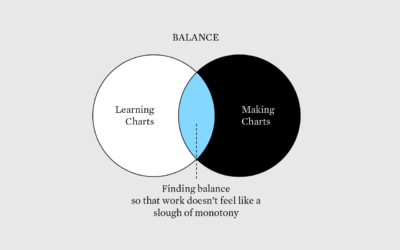
For Your Own Approval – The Process 181
Eventually you gotta make the charts for yourself and not for some expert’s approval.
-
Members Only
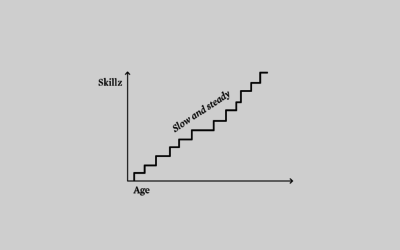
Foundational Visualization Skills – The Process 151
Set a strong base, and build whatever you want after that.
-
Members Only
Learning New Visualization Things Practically – The Process 149
Learn about new visualization things, but also get actual work done.
-
Members Only
Retired Minard – The Process 147
Maybe it’s better to focus on the present to do the best with what we have, which moves us towards the future.
-
10 statistical lessons from the past pandemic year
The Royal Statistical Society published ten lessons governments should takeaway from this year,…
-
Members Only
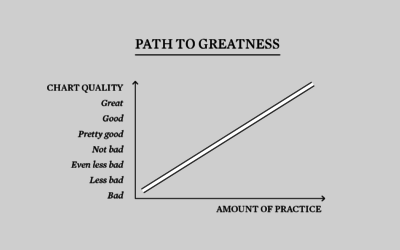
Make Bad Charts – The Process 128
Everyone’s a beginner at some point.
-
Members Only
Knowing Nothing (Process 119)
Obviously, knowing nothing can be a negative, but some of my favorite work came about when I didn’t know how to do something or what to expect.
-
Members Only
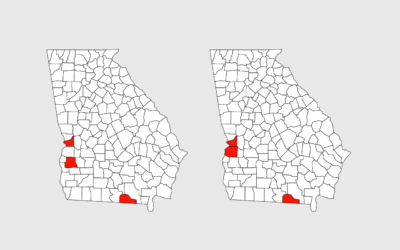
Maybe They’re Just Not Good at Charts Yet (The Process 099)
This week, people were taking a closer look at the Georgia Department of Public Health’s Covid-19 status page (again), which led to an unnecessary pile-on.
-
Members Only
Just Enough Chart (The Process #71)
For those new to visualization, learning all of the methods, implementations, tools, and guidelines can seem like a daunting task. Not to mention everything that happens before the actual visualizing, such as analysis, data formatting, and context-making. You don’t have to learn it all at once.
-
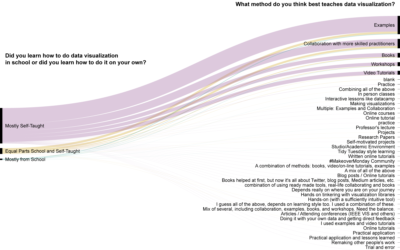
How practitioners learned data visualization
Visualization is still a relatively young field, so people learn about and how…
-
Members Only
Stolen Charts, Reusing Visualization Methods, and the Difference
In visualization, there are tools, templates, and defaults, which are meant to be copied and reused. Then there are data graphics that are designed with a specific purpose and dataset, which are something more than a certain chart type.
-
Members Only
Enjoy the Curve, Tools and Additional Resources Roundup – October 2018
Most people interested in visualization have made a chart with Microsoft Excel. For your basic charts, it’s really easy, and it works well for what it was intended for. The process of visualizing data with methods beyond the standard chart types can be more challenging at times.
-
Why People Make Bad Charts (and What to Do When it Happens)
It’s important to consider the reasons so that we don’t overreact. Otherwise, we’re just berating, pointing, and laughing all of the time, and that’s not good for anyone.
-
Beginner’s guide to visualization literacy
Mikhail Popov, a data scientist at the Wikimedia Foundation, led a workshop on…







 Visualize This: The FlowingData Guide to Design, Visualization, and Statistics (2nd Edition)


