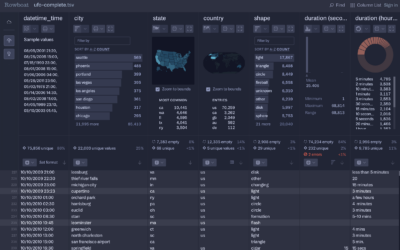
Fathom Information Design, known for client visualization-centric projects, introduced Rowboat. It’s a tool…
Fathom
-
Rowboat for fast CSV exploration
-
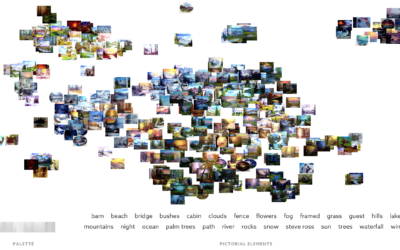
Mapping Bob Ross
Fathom Information Design recently made tools to find patterns in documents of text.…
-
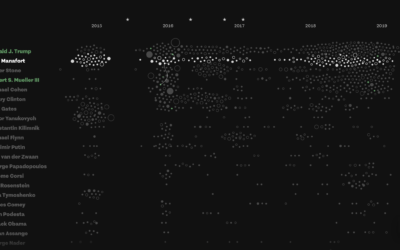
Connections and patterns in the Mueller investigation
While we’re on the subject of distributions, Fathom used a collection of beeswarm…
-
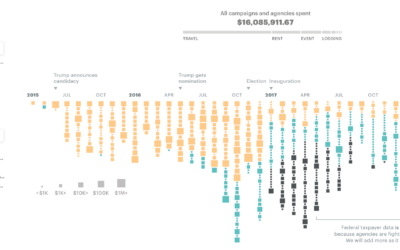
$16.1m in political and taxpayer spending at Trump properties
ProPublica compiled spending data from a wide range of sources to calculate the…
-
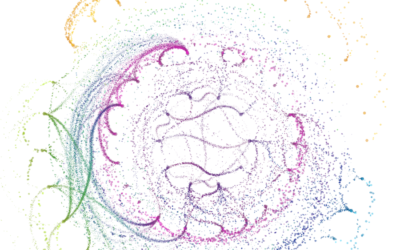
Network visualization shows transitions between states
If you think of network visualization as a collection of nodes and edges,…
-
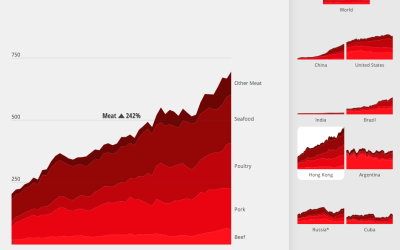
What the world eats
Diets vary around the world. Fathom Information Design for National Geographic charted the…
-
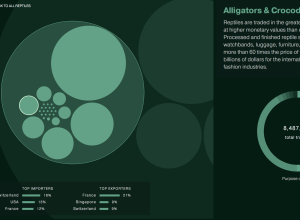
Traded animals
Based on data from the CITES Trade Database, “more than 27 million animals…
-
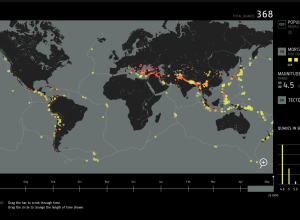
A year of earthquakes
Fathom provides an interactive browser for a year of earthquakes, based on data…
-
Equality for women and girls, 20-year report
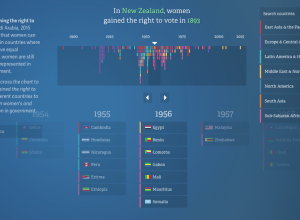
In their continued work on the No Ceilings project, Fathom describes the current…
-
No Ceilings highlights progress towards gender equality
No Ceilings: The Full Participation Project, an initiative from the Clinton Foundation, aims…
-
Mirador: A tool to help you find correlations in complex datasets
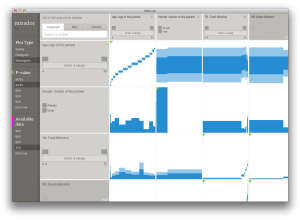
Mirador, a collaborative effort led by Andrés Colubri from Fathom Information Design, is…
-
Basketball movements visualized
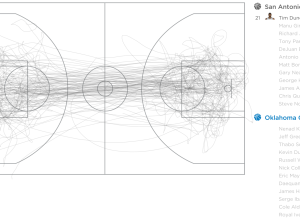
The NBA has been kind of gaga over data the past few years,…
-
Rocky movie breakdown
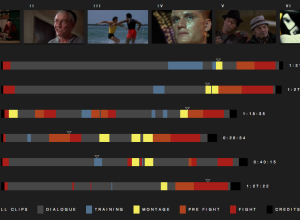
Fathom Information Design watched all six Rocky movies, classified segments into dialogue, training,…
-
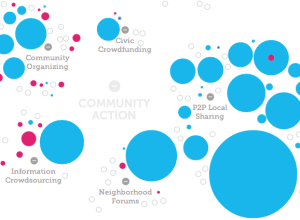
Growth in civic tech
Fathom Information Design, in collaboration with the Knight Foundation and Quid, visualized the…
-
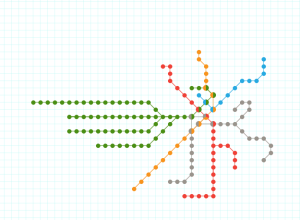
Exploration of how much geography is needed in metro maps
Terrence Fradet of Fathom Information Design ponders whether metro maps suffer or benefit…
-
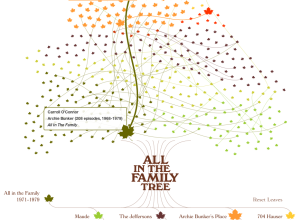
The family tree for All in the Family
James Grady from Fathom Information Design had a look at the family tree…
-
Link
Of kitchens, kittens, and Khrushchev →
Background from Fathom on their latest piece with GE, which explores keywords in annual reports
-
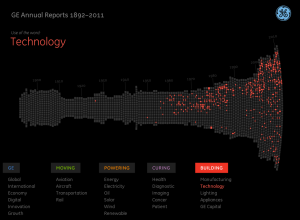
Innovation History via 6,000 Pages of Annual Reports
Fathom Information Design, in collaboration with GE, visualizes GE annual reports from 1892…
-
What seven billion people looks like
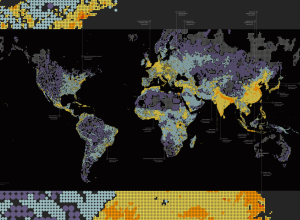
Form design intern at Fathom, James Grady, maps population density in Dencity:
Dencity… -
Stats of the Union tells health stories in America
Stats of the Union, the new Fathom-produced iPad app, maps the status of…



 Visualize This: The FlowingData Guide to Design, Visualization, and Statistics (2nd Edition)


