Want to have some fun and win an Amazon gift certificate in the process? Read on.
Personal data visualization has a huge advantage over other types of visualization. Personal visualization is about you, for you, and the data is from you. That’s a ton of background information with very little effort. As Jeffrey Heer noted in Socializing Visualization, people tend to spend more time exploring data when they connect personally to what they are seeing.
This Project’s For You
Running off this idea, this summer project is all about you – literally.
Take a moment and think about the data “flowing” off of you. How much did you spend on coffee over the past month? How much sleep did you get yesterday or the past week? Did you gain or lose weight this year? Look through your past billing statements, your iTunes listening history, or your car’s odometer.
Do you have a certain number (or series of numbers) in your head now? What do you see?
Read More
 I’m headed to Washington tomorrow for the

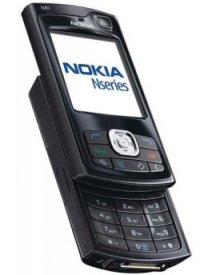 Mobile technology has come a long way from those foot-long phones hooked up to a shoe box sized battery pack. With bluetooth, GPS, cameras, and Internet connections, mobile phones nowadays pack a lot of power. How can we put this functionality to use?



 The more people who flock a story, the higher up the flock list the story goes. In the sidebar of each story is an interactive graphic that shows readers flocking around the news and stories getting highlighted. The larger the bubble, the more people who have flocked it; story bubbles light up orange when someone flocks it. The site isn’t showing any larger sizes, but a full screen version could be fun. Maybe a screensaver.
 Visualize This: The FlowingData Guide to Design, Visualization, and Statistics (2nd Edition)