John Allen Paulos, a math professor at Temple University, explains, in the New York Times, the importance of the before and after of when you get that data blobby thing in your hands.
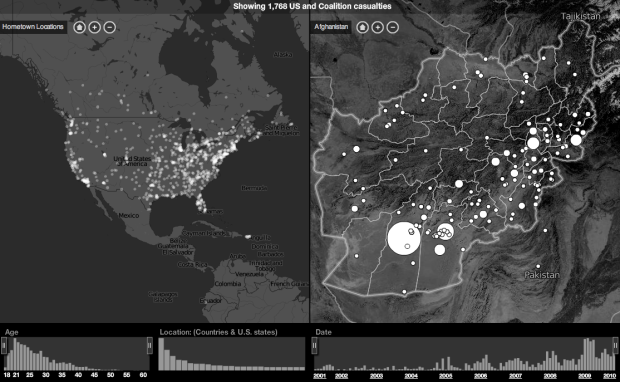
The problem isn’t with statistical tests themselves but with what we do before and after we run them. First, we count if we can, but counting depends a great deal on previous assumptions about categorization. Consider, for example, the number of homeless people in Philadelphia, or the number of battered women in Atlanta, or the number of suicides in Denver. Is someone homeless if he’s unemployed and living with his brother’s family temporarily? Do we require that a women self-identify as battered to count her as such? If a person starts drinking day in and day out after a cancer diagnosis and dies from acute cirrhosis, did he kill himself?
In a nutshell, statistics is a game of estimation. More often than not, the numbers in front of you aren’t an exact count. They could easily change if you shift the criteria of what was counted. As a result, there’s always some amount of uncertainty attached to your data, and it’s the statistician, analyst, and data scientist’s job to minimize that uncertainty.
So the next time you see a list of rankings like “fattest city” or “dumbest town,” don’t take it for absolute truth. Instead, think of it as an educated guess. Similarly, when you analyze and visualize, remember the context of your data.
Catch Paulos’ full article here.


 Visualize This: The FlowingData Guide to Design, Visualization, and Statistics (2nd Edition)


