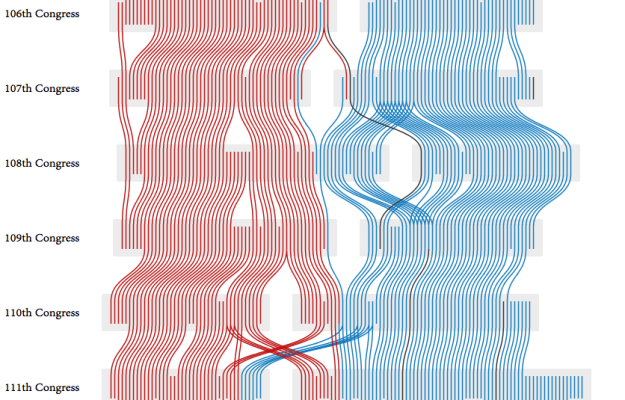
PhD student Adrien Friggeri demonstrates a new clustering algorithm with a visualization of the agreement groups within the United States Senate over time.
As you might imagine, there are two obvious groupings, Republican and Democrat. It gets interesting though when you look at Democrats classified as Republicans and vice versa. For example, the 11 Republicans placed in the Democratic group of the 110th Congress:
Most of whom are either moderates or closer to the Democrats than to their own party. Charles Hagel was critic of the Bush Administration which he described as “the lowest in capacity, in capability, in policy, in consensus — almost every area” of any presidency in the last forty years. George Voinovich has been known to oppose lowering taxes and frequently joined the Democrats on tax issues. John Warner is a moderate Republican and has centrist stances on many issues, to the point that he once faced opposition of other members of his own party when he decided to run for re-election.
Be sure to click on the gray boxes to follow the trajectories of different cohorts.
 What used to be a small specialty in a few newsrooms has grown some larger wings in the past couple of years. The challenge though is that a lot of journalists aren’t used to handling, let alone analyzing, a lot of data. The
 I listen to a lot of podcasts. They make my workouts much more enjoyable. For the most part though, I only listen to ones about sports and more general podcasts about design, technology, and working from home. However, a couple of months ago,
  Visualize This: The FlowingData Guide to Design, Visualization, and Statistics (2nd Edition)


