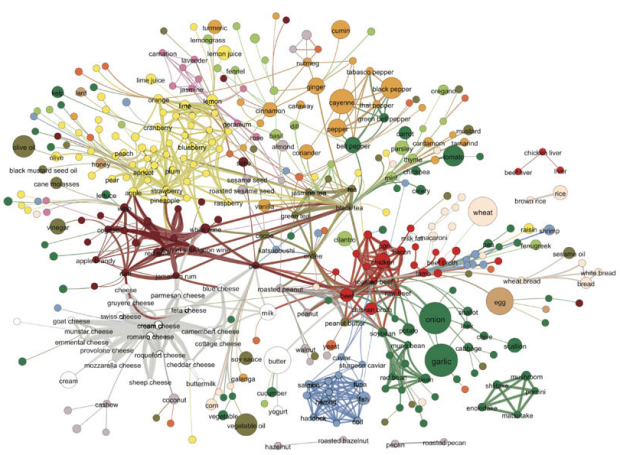
• The thing about cancer cells is that they suck. Their DNA is all screwy. They’ve got chunks of DNA ripped out and reinserted into different places, which is just plain bad news for the cells in our body that play nice. You know, kind of like life. Researchers at the Baylor College of Medicine in Houston have compared the DNA of a certain type of breast cancer cell to a normal cell and mapped the differences (and similarities) with the above visualization.

    The graphic summarizes their results. Round the outer ring are shown the 23 chromosomes of the human genome. The lines in blue, in the third ring, show internal rearrangements, in which a stretch of DNA has been moved from one site to another within the same chromosome. The red lines, in the bull’s eye, designate switches of DNA from one chromosome to another.

    Some design would benefit the graphic so that your eyes don’t bounce around when you look at the technicolor genome but it’s interesting nevertheless.

    Check out the Flare Visualization Toolkit or Circos if you’re interested in implementing a similar visualization with the above network technique.

    [Thanks, Robert]

  • Yes, watered down and flavorless beer has high drinkability. You know, sort of like water. The difference is shade of yellow.

  • COMING MAY 29

    Pre-order on Amazon
  • FlowingData posts will slow down this holiday week. I’m going to be busy watching all the movies coming out this Christmas and eating a lot of food that will inevitably cause extended hours of sleep. I hope all of you get to do the same or something similar. Merry Christmas and a happy new year!

    Regular posting will resume on January 1, 2009 to satisfy your data visualization needs. Try not to take it too hard, but if it’s too much to handle, try the FlowingData archives. There’s lots of good stuff in there.

  • Philip from infochimps posts the results of some heavy Twitter scraping. Data for 2.7 million users, 10 million tweets, and 58 million edges (i.e. connections between users) to satisfy your data hunger are available for download. I know a lot of you social network researchers will especially appreciate the big dataset, and best of all, Twitter gave Philip permssion to release. Yes, you could use the Twitter API, but isn’t it better when someone does it for you?

    Download the data here. The password is the Ramanujan taxicab number followed by the word
    ‘kennedy’ – all one word. Google is your friend, if that doesn’t make sense.

    [Thanks, Tim]

  • It’s hard to believe that another year has come and gone, but as I looked back on the FlowingData archives, it feels like ages since I wrote up some of these posts. I give you the most popular posts of 2008:

    1. 17 Ways to Visualize the Twitter Universe
    2. Winner of the Personal Visualization Project is…
    3. Watching the Growth of Walmart Across America, Interactive Edition
    4. 21 Ways to Visualize and Explore Your Email Inbox
    5. 12 Cool Visualizations to Explore Books
    6. Showing the Obama-Clinton Divide in Decision Tree Infographic
    7. 10 Largest Data Breaches Since 2000 – Millions Affected
    8. 23 Personal Tools to Learn More About Yourself
    9. Watch the Rise of Gasoline Retail Prices, 1993 – 2008
    10. 40 Essential Tools and Resources to Visualize Data

    Thank You

    At the beginning of this year, on January 1, 2008, FlowingData had 126 subscribers. Compare that to the now… wow. Thanks again for sharing FlowingData, everyone. Thank you for the comments, the suggestions, contest entries, and forum topics. FlowingData is what it is because of its readers. Lastly, thank you to the FlowingData sponsors – , , and – who help me keep up with FlowingData’s growth.

    Here’s to an exciting 2009.

  • During major events, people use their mobile phones to share their emotions: the euphoria of a football match in Spain or Romania, World Music Day in France, or Saint John’s night in Poland. We want to share our excitement, so we call up our close friends and family. Urban Mobs allows us to see this activity in four major European cities – this “urban heartbeat” so to speak.

    So when is someone going to do something for the United States?

    [Thanks, @MacDivaONA]

  • I made a few updates to the FlowingData forums last night – the main being the ability to upload attachments. You’ve always been able to post images, but now you don’t have to link to some remote server. That means it’s much easier to share visualization with everyone now. It’s also where I will host all future contests and giveaways. So go register now!

    Oh, and one more thing – I added two new sections for Events and Finding a Job, so if you’re looking for or want to publicize a workshop or conference; or if you’re looking for work or looking for someone to work for you, that’d be the place to do it.

    From the Forums

    Tis the season for… infographics contests – Win $500 from GOOD Magazine or a free subscription to Chance Magazine [Thanks, Alberto].

    UK Wired Article Help – johno is writing a feature for UK Wired Magazine (launching this spring) on lifetracking and wants to talk to those involved with self-tracking.

    Associate in Research for Software Development – There’s a data visualization position open at Duke University

    Visualization software used… – A short discussion what people use to visualize data.

  • Have a good weekend all. I’ll be getting buried in the expected 12 inches of snow here in Buffalo in the meantime :).

    [via superpoop | Thanks, Georgina and @tarheelcoxn]

  • Data visualization continues to grow online and in the real world. It exists as masterful art pieces and amazingly useful analysis tools. In both cases though it brings data — which is oftentimes cryptic — to the masses and shows that data is more than a bucket of numbers. Data is interesting. As we collect more and more data about ourselves and our surroundings, the data and the visualization will only get more interesting. On that note, I give you FlowingData’s picks for the top 5 data visualization projects of 2008. Visualizations were judged based on the use of data, aesthetics, overall effect on the visualization arena, and how well they told a story.
    Read More

  • The great thing about being a graduate student is that you get to experiment. Anita Lillie, from the MIT Media Lab, demos MusicBox, her master’s thesis project that visualizes and maps music collections based on songs’ acoustic features. As might be expected, she uses principle components analysis to arrange songs. Each dot represents a song. If two songs sound similar, they should appear close to each other. As an example, the above dots are colored by music genre. Rap songs appear on the left in red while classical appears on the right.

    As an aside, Anita’s project reminds me a lot of a GGobi demo by Di Cook. She used the tuneR library in R to quantify Beatles songs and then used GGobi to do something similar to MusicBox. R and GGobi are free to use, so if you’re interested in visualizing your own music library, you might want to check them out.

    [via TechCrunch]

  • In his latest data sculptures, Andreas Nicolas Fischer places data visualization in a physical space when we’re so used to seeing it on a computer monitor. Above is a piece of two layers – the bottom is gross domestic product for 2007 (made of plywood) and the top maps “the derivatives volume, alloted to the coordinates of the countries on a map.” I don’t know what derivatives volume and I probably should, but I’m too lazy to look it up (a lil’ help please?).
    Read More

  • You can use the vector-based software normally reserved for designers and artists to make and edit charts.

  • SiSense is running a dashboard competition, and a free iPod Touch is up for grabs. All you have to do is create the best dashboard using SiSense — which is free to try for 30 days. You’ve got until December 22 (that’s one week away) to enter, so you better jump on it.

    Here’s your motivation:


  • Photo by Darwin Bell

    It happened again. I told someone I study statistics. He told me that he hated statistics in college. It doesn’t annoy me like it used to – I’ve come to expect it – but why do so many people have this beef with stat? Is it really that boring? Confusing? What is it about statistics that turns people off? So I reach out to all of you:

    What is it that makes statistics so uninteresting?

    I’m going to assume that the icky factor is less for FlowingData readers (obviously), but still, I implore you – tell me why statistics sucks. I must know.

  • I thought this was a joke when I first read it, but scientists from Japan’s ATR Computational Neuroscience Laboratories have developed software that can map brain activity to an image. Subjects were shown letters from the word neuron and images were reconstructed and displayed on a computer screen.

    A spokesman at ATR Computational Neuroscience Laboratories said: “It was the first time in the world that it was possible to visualise what people see directly from the brain activity.

    “By applying this technology, it may become possible to record and replay subjective images that people perceive like dreams.” The scientists, lead by chief researcher Yukiyaso Kamitani, focused on the image recognition procedures in the retina of the human eye.

    It is while looking at an object that the eye’s retina is able to recognise an image, which is subsequently converted into electrical signals sent into the brain’s visual cortex.

    The research investigated how electrical signals are captured and reconstructed into images, according to the study, which will be published in the US journal Neuron.

    I’m not sure how much brain activity from the retina has to do with activity during dreams, but it’s interesting nevertheless (although I am sure – like all interesting science – it is slightly hyped by the media).

    [via Telegraph & Pink Tentacle & Chunici]

  • One of the more painful parts of analysis or visualization is that you have to get the data in a proper format. Real data almost never comes how you want it. Magic/Replace from DabbleDB lets you reformat data via their spreadsheet interface and a few sprinkles of magic. The solution is really quite elegant.

    You copy and paste CSV or TSV from a spreadsheet and submit. You then see a column editor and a preview window. This is where the magic happens. In the column editor, you can edit a column so that it fits a certain format and Magic/Replace will show you a preview of what the others will look like. For example, say you have a column of phone numbers and they’re in the (555) 555-5555 format, but what you really want is 555-555-5555. Change a single row, and voila, Magic/Replace does the rest. It really is “data cleanup for everyone” – not that the data were dirty to begin with.

    [Thanks, Jose]

  • I ran a contest last week to improve a graph from Swivel that showed immigration to the United States. FlowingData readers sent in lots of different approaches (that took me forever to get organized for this post), and I still stand by my statement that there’s always more than one way to skin a dataset.
    Read More

  • I got an email from Harald asking, “How does the job market for DV developers work?” I find this question, or some variation of it, in my inbox every now and then, so I thought I’d give it a shot. I am after all a graduate student who will graduate eventually, so let’s take a look at some of the options. I’d like to expand on the question though, and not just focus on developers. What’s the job market like for anyone who wants to do data visualization for a living?
    Read More

  • The Washington Post recently put up TimeSpace: World, which is an interactive map that shows articles, video, photos, and commentary as they happen around the world (through the Washington Post’s eyes). Similar to Trulia Snapshot, by Stamen Design, news items are arranged with a force-directed graph and can be filtered by time with a timeline at the bottom. Adjust time range to find news stories from a given time of day. You get a breakdown of number of images, articles, etc. Photos seem to dominate. Here is the embedded version (which seems a little buggy):

    One thing that I really liked about Trulia Snapshot, which isn’t included as a part of TimeSpace: World is a play button. It’d be like watching the news unfold over time – or even better, make TimeSpace self-updating. Maybe in the next iteration.

    [Thanks, Steven]