Thanks for making this a memorable year, everyone. Happy holidays!
Merry Christmas to you, from FlowingData
7 Comments
Second Edition
 Visualize This: The FlowingData Guide to Design, Visualization, and Statistics (2nd Edition)
 Visualize This: The FlowingData Guide to Design, Visualization, and Statistics (2nd Edition)
New tools, refined process.
Nicely done… only problem is that the distance from 0 to 1 on the y axis shouldn’t be the same as the other distances, since 0 is actually undefined on the log axis. (Comment intended to be humorous)
Mele Kalikimaka as well! *<:-)
Thank you, Nathan, for your wonderful blog. I hope 2012 is filled with smiles.
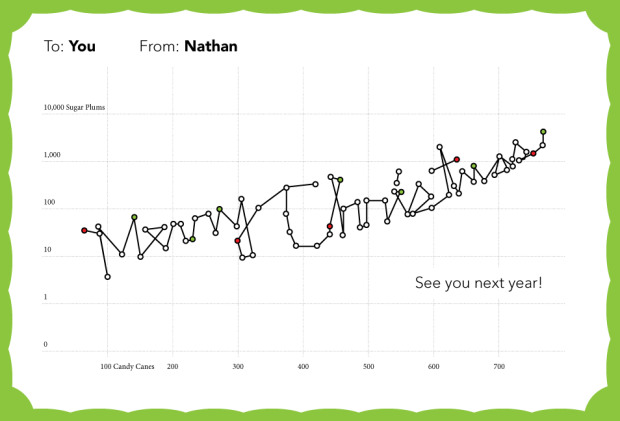
I’d like to know the source of the data portrayed in this graph.
Got it direct from Santa. It only makes sense if you believe.
Really like the stuff you are publishing……….If they’re not inspiring anyone……I’m truly Inspired keep doing what you do!
Nathan, thanks for all your work. It is very much appreciated.