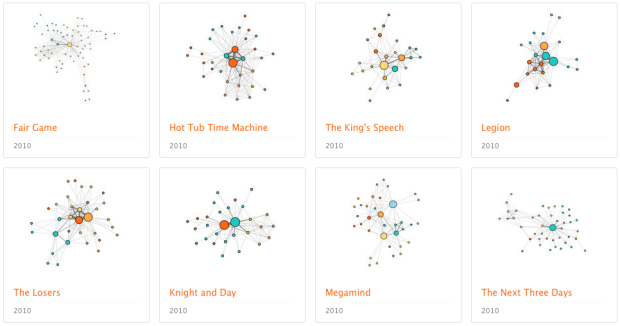
• As you know, states have received billions of dollars of federal stimulus funding. But do you know where all the money goes?

    Stamen Design, in its most recent project with the State of California, lets you explore the money breakdown. Like most of Stamen’s work, at the base is an interactive map, but it is of course much more than that.

    Roll over for breakdowns, search for your city or county, select sectors of interest, and take a look at project-specific information. The color-coded bars change depend on what’s geographically in view, and the map zooms in on points of interest on the fly.

    In Eric’s words, “It’s just slick as hell.”

  • In this day and age, we should all be thinking about how we can better conserve the environment, because if we don’t, well you know, the planet will die. In a follow-up to my previous eco-friendly list, here are 10 more infographics and visualizations on going green.
    Read More

  • Ben Fry, well-known for Processing and plenty of other data goodness, announced his most recent piece, On the Origin of Species: The Preservation of Favoured Traces, made possible by The Complete Work of Charles Darwin Online.

    The visualization explores the evolution of Charles Darwin’s theory of, uh, evolution. It began as a less-defined 150,000-word text in the first edition and grew and developed to a 190,000-word theory in the sixth edition.

    Watch where the updates in the text occur over time. Chunks are removed, chunks are added, and words are changed. Blocks are color-coded by edition. Roll over blocks to see the text underneath.

    As usual, excellent work, Mr. Fry.

    Happy labor day!

  • May you make it to the top of the mountain of success. I think I’m somewhere around the mountain of lack of preparation. Where are you?

    [via Strange Maps]

    UPDATE: Here’s the full-sized version, originally from The Etude in 1913. [Thanks, @idefine]

  • Applied Security VisualizationWe passed the 20k-subscriber mark last week. Very cool, and a tiny bit scary at the same time. Thank you everyone for reading and spreading the word about FlowingData. Thank you, thank you, thank you. I’m looking forward to what the next few months brings.

    Anyways, I’ve found that the best way to celebrate these types of milestones is with some free stuff :). Plus it’s Friday.

    Applied Security Visualization

    I have five free copies of Applied Security Visualization to give away. While the book is geared towards network security, the principles behind each chapter can certainly be applied to other types of visualization. The book also includes free software for visualizing networks and assessing security.

    How to Win

    Super easy. Just leave a comment below that says what you’re thankful for. You are not allowed to say you are thankful for free stuff, wise guy. Do this by Sunday, September 6, 2009, 8pm EST. Comments will then close, and I will randomly select five winners. One entry per person please. Good luck!

    Update: I forgot about Labor Day. Extending the entry deadline to Monday, Sept. 7, 8pm EST.

  • i-am-bored graphs the horrible to awesome of becoming a man. Growing up ain’t easy. So who’s going to do the highs and lows of being a young woman?

    Have a nice weekend all.

  • Someone I respect a lot said I should let go. And so I did.

    We now return to our regularly scheduled data goodness. Thanks, all.

  • Are you looking to get into data visualization, but don’t quite know where…

  • After yesterday’s weirdness, I’m in the mood for something light.

    The show about nothing lasted nine seasons, during which Jerry, George, Kramer, and Elaine interacted with a whole lot of people. Ricky Linn, a graphic design student, mapped all the relationships over the years.

    Connecting lines are color-coded by type of relationship. It looks like Kramer was more about making friends while Jerry and George were more the dating type. I guess Elaine kept a tighter circle of friends.

  • What if you were a good student but knew you weren’t going to be able to go to college?

    I was fortunate enough for most of my life to know that if I wanted to get a higher education, I would be able to. Thanks, Mom and Dad. It’s hard for me to imagine working hard in middle school and high school if I didn’t have that goal in mind, but that’s the path that many grow up with.

    The above graph are the results of a study by the Department of Education started in 1988. It shows that low-income students are most likely not to complete college – despite doing well in 8th grade. It’s a much different story for high-income students.

    The Department tracked student progress in 8th grade and through high school and college over the next 12 years. Only 3% of students, from low income families, with low 8th grade math performance, completed college. Compare that to students with the same math performance but from high income families. Thirty percent finished college. That’s ten times more than the former.

    What’s worse is that many low-income students who had high math performance still didn’t complete college. The percentage of college completion for low-income, high math students was still lower than high-income, low math students.

    [via @golan]

  • Following up from last year’s beer graphic, Mike Wirth looks at medal winners from this year’s at the Great American Beer Festival since 1987. This year’s festival is September 24-26.

    This time around is a little more context about the breweries in America, namely the number of breweries per state. It looks like someone used Many Eyes for some bubble fun.

    Also, as suggested by FD readers for the 2008 graphic, Mike includes rankings by state both by number of medals and medals per capita. Vermont wins per capita. Alaska’s up there at number 6. Actually, the top states per capita seem to be mostly northern states. Gotta stay warm, eh?

    [via lyke2drink | Thanks, Mike]

  • Jeannie Harrell takes Total Eclipse of the Heart by Bonnie Tyler, and puts it in flowchart form. Yes, you guessed it. It’s Friday. And what better way to start the weekend with the music video in all its 1980s glory.
    Read More

  • yfd logoIt’s been fun to see your.flowingdata evolve the past few weeks, and it’s good to see so many of you making use of it. Thanks for all the useful feedback too.

    For those already using YFD, you’ll be pleased to know there are a few new features. If you haven’t had the chance, you can start collecting data with YFD in just a few steps.
    Read More

  • I Google myself every now and then. Everyone does. I don’t know why people act like it’s all weird to do it. We’re all interested in what’s out there on the Internet about us or someone with the same name as us. Some of it is right. A lot of it is wrong. Personas, from MIT’s Metropath(ologies) exhibit, scours the Web and attempts to characterize how the Internet sees you.

    In a world where fortunes are sought through data-mining vast information repositories, the computer is our indispensable but far from infallible assistant. Personas demonstrates the computer’s uncanny insights and its inadvertent errors, such as the mischaracterizations caused by the inability to separate data from multiple owners of the same name. It is meant for the viewer to reflect on our current and future world, where digital histories are as important if not more important than oral histories, and computational methods of condensing our digital traces are opaque and socially ignorant.

    The piece is about the incorrectness of your Internet profile just as much as what’s right.

    As many have pointed out, the end result is kind of anti-climatic, but it’s fun to watch the process at work, which makes heavy use of natural language processing algorithm latent Dirichlet allocation [pdf] from Blei, et. al.

    How does the Internet see you?

    [via infosthetics | Thanks, Alexandria]

  • The Texas in a Bottle guide to Texas Wine [pdf] reads:

    Ever listen to somebody describe a wine? They talk about it having “character” and “personality.” To hear them tell it, wines are a lot like people. We’ve talked it over and came to a conclusion – they have it backwards. People are a lot like wines.

    And to that end, Go Texan Wine goes on to describe your personality based on what type of wine you prefer. Do you like Merlot? There’s a mystical side to you, slightly mischievous, but that only makes you the life of the party.

    I’m difficult. I’m demanding. But oh, oh, oh, I am so worth it. What’s your wine personality?

    [via Cool Infographics]

  • As far back as I can remember there’s always been a mystique around the Kennedy family. It’s almost like if you bear the Kennedy name, you’re destined for greatness. With the recent passing of Eunice Kennedy Shriver, Patterson Clark of The Washington Post maps out the famous family tree. The tree starts with the marriage of Joseph Patrick Kennedy and Rose Elizabeth Fitzgerald and branches out to current family members and what they do for a living.

    [via DataViz]

  • David McCandless from Information is Beautiful plots the calories in popular beverages versus the amount of caffeine in them. At the bottom right of the plot are drinks low in calories and high in caffeine. At the opposite end, top left, are beverages of high calories and low in caffeine. Food items (on the left) and physical activity (on the right) provide context to the calories.

    [Thanks, Peter]

  • I, uh, well. Hmm. Yeah. New Scientist recently compiled a list of visualizations exploring the growth of the Internet. Here they are in no particular order (plus the one above).
    Read More

  • Map/Territory, by designer Timo Arnall, is a concept video of what it might be like to interact with a map embedded in real life – not just on a phone or on a computer screen. Imagine a world where a flick of the wrist draws up all the information you need in real time and space. Check out the 30-second clip below:

    I really love stuff like this. Stuff like Map/Territory, Bruce Branit’s holographic world, Microsoft’s vision for 2019, or even the Starship Enterprise is simply beautiful. It’s fun to imagine what the future might be like.

    Nevermind the how part. Technically speaking, I have no idea how Map/Territory would ever come to fruition, and I’m pretty sure Timo doesn’t either, but who cares? While technical know-how is absolutely useful and completely necessary, sometimes you need imagination and creativity to push the boundaries of what’s possible.

    [via O’Reilly Radar]

  • As many of you know I’m just one graduate student maintaining FlowingData. Needless to say I would not have been able to handle the financial load without the FlowingData sponsors. Projects like your.flowingdata and FlowingPrints (coming soon) probably wouldn’t be around either.

    So thank you, sponsors for your support. Please do check out their offerings. They all aim to make data useful, which is what FlowingData is all about.

    InstantAtlas — Enables information analysts to create interactive maps to improve data visualization and enhance communication.

    NetCharts — Build business dashboards that turn data into actionable information with dynamic charts and graphs.

    Tableau Software — Data exploration and visual analytics for understanding databases and spreadsheets that makes data analysis easy and fun.

    IDV Solutions — Create interactive, map-based, enterprise mashups in SharePoint.

    Freakalytics — Get Tableau Training- live, hands-on by author of “Rapid Graphs.” Registration is opening up across the country.

    Want to sponsor FlowingData, your most favorite blog in the whole wide world? Email me, and I’ll get back to you with the details.