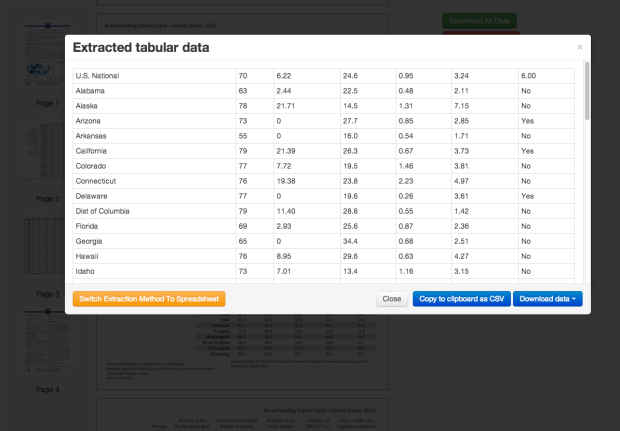
The American Community Survey, an ongoing survey that the Census administers to millions per year, provides detailed information about how Americans live now and decades ago. There are tons of data tables on topics such as housing situations, education, and commute. The natural thing to do is to download the data, take it at face value, and carry on with your analysis or visualization.
However, as is usually the case with data, there’s more to it than that. Paul Overberg, a database editor at USA Today, explains in a practical guide on how to get the most out of the survey data (which can be generalized to other survey results).
Journalists who use ACS a lot have a helpful slogan: “Don’t make a big deal out of small differences.” Journalists have all kinds of old-fashioned tools to deal with this kind of challenge, starting with adverbs: “about,” “nearly,” “almost,” etc. It’s also a good idea to round ACS numbers as a signal to users and to improve readability.
In tables and visualizations, the job is tougher. These introduce ranking and cutpoints, which create potential pitfalls. For tables, it’s often better to avoid rankings and instead create groups—high, middle, low. In visualizations, one workaround is to adapt high-low-close stock charts to show a number and its error margins. Interactive data can provide important details on hover or click.
If you do any kind of data reporting, whatever field it’s in, you should be familiar with most of what Overberg describes. If not, better get your learn on.


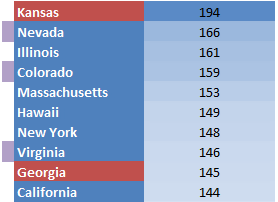 Pornhub continues their analysis of porn viewing demographics
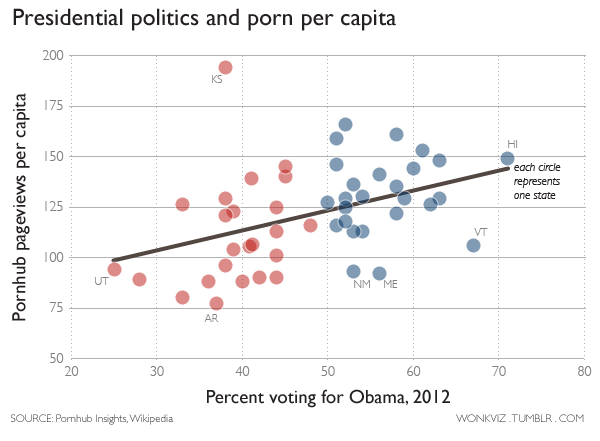


 Visualize This: The FlowingData Guide to Design, Visualization, and Statistics (2nd Edition)


