• Membership
  • Newsletter
  • Projects
  • Learning
  • About
  • Member Login
  • Share your traces with a stranger

    May 14, 2014

    Topic

    Self-surveillance  /  anonymity, MIT Media Lab

    The MIT Media Lab Playful Systems group is working on an experiment in data sharing, on a personal level. It’s called 20 Day Stranger. You install an app on your phone that tracks your location and what you’re doing, and that information is anonymously shared with a stranger. You also see what that stranger is doing.

    I can’t decide if this is creepy or touching, or somewhere in between. I put myself on the waiting list to find out, but I imagine the experience has a little bit to do with the app and much more to do with the stranger on the other side.

  • Job Board, May 2014

    May 14, 2014

    Topic

    Job Board

    Looking for a job in data science, visualization, or statistics? There are openings on the board.

    Senior UX Designer, Data Visualization for Integral Ad Science in New York, New York.

    Data Visualization Front-End Developer for the Mintz Group in New York, New York.

    Data Visualizer for Datalabs Agency in Melbourne, Australia.

  • Responsive data tables

    May 13, 2014

    Topic

    Coding  /  NPR, responsive design

    Alyson Hurt for NPR Visuals describes how they make responsive data tables for their articles. That is, a table might look fine on a desktop but then it might be illegible on a mobile device. This is a start in making tables that work in more places.

  • NBA basketball fans by ZIP code

    May 13, 2014

    Topic

    Maps  /  basketball, facebook, Upshot

    After the popularity of The Upshot’s baseball fandom map, it’s no surprise the same group followed up with an NBA map of the same ilk. Same Facebook like data but for basketball. And as before, although the national map is fun, the regional breakdowns is the best part.

  • Random things that correlate

    May 12, 2014

    Topic

    Statistics  /  correlation, humor

    This is fun. Tyler Vigen wrote a program that attempts to automatically find things that correlate. As of writing this, 4,000 correlations were found so far (and actually over 100 more when I finished). Some of the gems include: the divorce rate in Maine versus per capita consumption of margarine, marriage rate in Alabama versus whole milk consumption per capita, and honey produced in bee colonies versus labor political action committees. Many things correlate with cheese consumption.

  • Type I and II errors simplified

    May 9, 2014

    Topic

    Statistics  /  humor, hypothesis testing

    “Type I” and “Type II” errors, names first given by Jerzy Neyman and Egon Pearson to describe rejecting a null hypothesis when it’s true and accepting one when it’s not, are too vague for stat newcomers (and in general). This is better. [via]

  • Name popularity by state, animated by year

    May 9, 2014

    Topic

    Maps  /  baby names, interactive

    Using baby name data from the Social Security Administration, Brian Rowe made this straightforward interactive that lets you search a name to see how its regional popularity changed over over time.

    Name by state

  • Optimizing your R code

    May 9, 2014

    Topic

    Coding  /  Hadley Wickham, optimization, R

    Hadley Wickham offers a detailed, practical guide to finding and removing the major bottlenecks in your R code.

    It’s easy to get caught up in trying to remove all bottlenecks. Don’t! Your time is valuable and is better spent analysing your data, not eliminating possible inefficiencies in your code. Be pragmatic: don’t spend hours of your time to save seconds of computer time. To enforce this advice, you should set a goal time for your code and only optimise only up to that goal. This means you will not eliminate all bottlenecks. Some you will not get to because you’ve met your goal. Others you may need to pass over and accept either because there is no quick and easy solution or because the code is already well-optimized and no significant improvement is possible. Accept these possibilities and move on to the next candidate.

    This is how I approach it. Some people spend a lot of time optimizing, but I’m usually better off writing code without speed in mind initially. Then I deal with it if it’s actually a problem. I can’t remember the last time that happened though. Obviously, this approach won’t work in all settings. So just use common sense. If it takes you longer to optimize than it does to run your “slow” code, you’ve got your answer.

  • Naked Statistics

    May 8, 2014

    Topic

    Statistics  /  book review, Charles Wheelan, guide

    Naked Statistics by Charles Wheelan promises a fun, non-boring introduction to statistics that doesn’t leave you drifting off into space, thinking about anything that is not statistics. From the book description:

    For those who slept through Stats 101, this book is a lifesaver. Wheelan strips away the arcane and technical details and focuses on the underlying intuition that drives statistical analysis. He clarifies key concepts such as inference, correlation, and regression analysis, reveals how biased or careless parties can manipulate or misrepresent data, and shows us how brilliant and creative researchers are exploiting the valuable data from natural experiments to tackle thorny questions.

    Naked StatisticsThe first statistics course I took—not counting the dreadful high school stat class taught by the water polo coach—actually drew me in from the start. Plus, I needed to finish my dissertation, so I didn’t pick it up when it came out last year.

    I saw it in the library the other day though, so I checked it out. If anything, I could use a few more anecdotes to better describe statistics to people before they tell me how much they hated it.

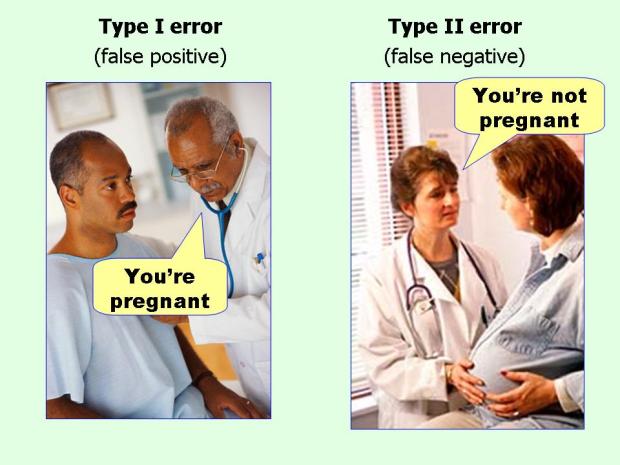
    Naked Statistics is pretty much what the description says. It’s like your stat introduction course with much less math, which is good for those interested in poking at data but well, slept through Stat 101 and have an irrational fear of numbers. You get important concepts and plenty of reasons why they’re worth knowing. Most importantly, it gives you a statistical way to think about data, flaws and all. Wheelan also has a fun writing style that makes this an entertaining read.

    For those who are familiar with inference, correlation, and regression, the book will be too basic. It’s not enough just for the anecdotes. However, for anyone with less than a bachelor’s degree (or equivalent) in statistics who wants to know more about analyzing data, this book should be right up your alley.

    Keep in mind though that this only gets you part way to understanding your data. Naked Statistics is beginning concepts. Putting statistics into practice is the next step.

    Personally, I skimmed through a good portion of the book, as I’m familiar with the material. I did however read a chapter out loud while taking care of my son. He might not be able to crawl yet, but I’m hoping to ooze some knowledge in through osmosis.

  • Downloading Your Email Metadata

    Email provides a window into who we interact with and what we do. This tutorial describes how to get that data in the format you want.

  • Crystal clusters of world data

    May 7, 2014

    Topic

    Data Art  /  algorithm, crystals, physical

    Artist Scott Kildall generates what he calls World Data Crystals by mapping data on a globe with cubes and clustering them algorithmically. He then produces the result in physical form for something like the piece below, which represents world population.

    World population crystal

  • Most underrated films

    May 6, 2014

    Topic

    Data Sources  /  ggplot, RottenTomatoes

    Rotten Tomatoes film ratingsBen Moore was curious about overrated and underrated films.

    “Overrated” and “underrated” are slippery terms to try to quantify. An interesting way of looking at this, I thought, would be to compare the reviews of film critics with those of Joe Public, reasoning that a film which is roundly-lauded by the Hollywood press but proved disappointing for the real audience would be “overrated” and vice versa.

    Through the Rotten Tomatoes API, he found data to make such a comparison. Then he plotted one against the other, along with a quick calculation of the differences between the percentage of official critics who liked and that of the Rotten Tomatoes audience. The most underrated: Facing the Giants, Diary of a Mad Black Woman, and Grandma’s Boy. The most overrated: Spy Kids, 3 Backyards, and Stuart Little 2.

    The plot would be better without the rainbow color scheme and a simple reference line through the even-rating diagonal. But this gets bonus points for sharing the code snippet to access the Rotten Tomatoes API in R, which you can generalize.

  • Create a barebones R package from scratch

    May 6, 2014

    Topic

    Coding  /  package, R

    While we’re on an R kick, Hilary Parker described how to create an R package from scratch, not just to share code with others but to save yourself some time on future projects. It’s not as hard as it seems.

    This tutorial is not about making a beautiful, perfect R package. This tutorial is about creating a bare-minimum R package so that you don’t have to keep thinking to yourself, “I really should just make an R package with these functions so I don’t have to keep copy/pasting them like a goddamn luddite.” Seriously, it doesn’t have to be about sharing your code (although that is an added benefit!). It is about saving yourself time. (n.b. this is my attitude about all reproducibility.)

    I need to do this. I’ve been meaning to wrap everything up for a while now, but it seemed like such a chore. Sometimes I even go back to my own tutorials for copy and paste action. Now I know better. And that’s half the battle.

  • R for cats and cat lovers

    May 6, 2014

    Topic

    Coding  /  introduction, R

    Programmer catFollowing the lead of JavaScript for Cats by Maxwell Ogden, Scott Chamberlain and Carson Sievert wrote R for Cats. It’s a playful introduction to R intended for those who have little to no programming experience.

    The bulk of it so far is a primer on data structures, and there’s a little bit on functions and some dos and don’ts. It’s stuff you should know before you get into more advanced tutorials.

    Mainly though: ooo look, kitty.

    Once you’re done with that (It only takes about 30 minutes.), there are lots of other resources for getting started with R.

  • Hip hop vocabulary compared between artists

    May 5, 2014

    Topic

    Statistics  /  music, rapper, vocabulary

    Matt Daniels compared rappers’ vocabularies to find out who knows the most words.

    Literary elites love to rep Shakespeare’s vocabulary: across his entire corpus, he uses 28,829 words, suggesting he knew over 100,000 words and arguably had the largest vocabulary, ever.

    I decided to compare this data point against the most famous artists in hip hop. I used each artist’s first 35,000 lyrics. That way, prolific artists, such as Jay-Z, could be compared to newer artists, such as Drake.

    As two points of reference, Daniels also counted the number of unique words in the first 5,000 used words from seven of Shakespeare’s works and the number of uniques from the first 35,000 words of Herman Melville’s Moby-Dick.

    I’m not sure how much stock I would put into these literary comparisons though, because this is purely a keyword count. So “pimps”, “pimp”, “pimping”, and “pimpin” count as four words in a vocabulary and I have a hunch that variants of a single word is more common in rap lyrics than in Shakespeare and Melville. Again, I’m guessing here.

    That said, although there could be similar issues within the rapper comparisons, I bet the counts are more comparable.

  • Your mobility at various times during the day

    May 2, 2014

    Topic

    Maps  /  commute, traffic

    Isoscope, a class project by Flavio Gortana, Sebastian Kaim and Martin von Lupin, is an interactive that lets you explore mobility around the world.

    We drive to the closest supermarket, take the bike to the gym or walk to the cafe next door for a nice chat among friends. Getting around — thus mobility — is an essential part of our being. We were especially intrigued by those situations when our mobility is compromised such as in traffic jams or during tough driving conditions. How do those restrictions impact our journeys through the city and who is affected most? Obviously, a car can hardly bypass a traffic jam, whereas a bike is more flexible to continue its journey. Let alone the pedestrian who can stroll wherever he wants to. Isoscope tries to answer the questions above by comparing different means of transport and their sensitivity for disturbances.

    Similar in flavor to the commute maps before it, Isoscope is a bit different in that it focuses on specific time frames, such as Fridays at 8am. Using data from the HERE API, a travel polygon is estimated for each hour of the day selected. Your initial result is an abstract blot overlaid on a map, but then use the menu to change days and highlight hours.

  • The size of Game of Thrones dragons compared

    May 1, 2014

    Topic

    Infographics  /  fiction, Game of Thrones, size

    Because Game of Thrones. Max Fleishman and Fernando Alfonso III for The Daily Dot compared the size of dragons on various shows and movies, from Mushu to Toothless to Smaug to Balerion. The tiny black dot on the left bottom corner is a person.

    See also the size comparison of science fiction starships, Pixar characters, and everything else.

  • Views of white Americans

    May 1, 2014

    Topic

    Statistical Visualization  /  Amanda Cox, New York Times, racism

    Views of White Americans by Amanda Cox at NYTIn light of the Donald Sterling brouhaha, Amanda Cox for The Upshot put up some charts for why you shouldn’t be surprised that people still say racist things, based on data from the General Social Survey dating back to 1972. Mmhm.

  • Hiding a pregnancy from advertisers

    May 1, 2014

    Topic

    Statistics  /  marketing, pregnancy, target

    You probably remember how Target used purchase histories to predict pregnancies among their customer base (although, don’t forget the false positives). Janet Vertesi, an assistant professor of sociology at Princeton University, made sure that sort of data didn’t exist during her nine months.

    First, Vertesi made sure there were absolutely no mentions of her pregnancy on social media, which is one of the biggest ways marketers collect information. She called and emailed family directly to tell them the good news, while also asking them not to put anything on Facebook. She even unfriended her uncle after he sent a congratulatory Facebook message.

    She also made sure to only use cash when buying anything related to her pregnancy, so no information could be shared through her credit cards or store-loyalty cards. For items she did want to buy online, Vertesi created an Amazon account linked to an email address on a personal server, had all packages delivered to a local locker and made sure only to use Amazon gift cards she bought with cash.

    The best part was that her modified activity—like purchasing $500 worth of Amazon gift cards in cash from the local Rite Aid—set off other (in real life) triggers.

  • Interactive visualization used as music video

    April 30, 2014

    Topic

    Data Art  /  George and Jonathan, music

    George & Jonathan used an interactive audio visualization for their recent album George & Jonathan III. This is a fun one. You can rotate the camera as you like, as the full album plays and notes are represented with dashes and dots.

  • Page 222 of 393
  • <
  • 1
  • ...
  • 219
  • 220
  • 221
  • 222
  • 223
  • 224
  • ...
  • 393
  • >

Analyze, visualize, and communicate data usefully, beyond the defaults.

Become a member →

Recently for Members

May 22, 2025
Conflicting points of view over the same data

May 15, 2025
Step Chart, Enhanced

May 8, 2025
When the data is not what it seems

May 1, 2025
Finding the Right Charts

April 24, 2025
Visualization Tools, Datasets, and Resources – April 2025 Roundup

Second Edition

Visualize This: The FlowingData Guide to Design, Visualization, and Statistics (2nd Edition)

Order: Amazon / Bookshop

Browse by Chart Type See All →

Calendar Cartogram Pie Chart Timeline Box Plot Pictogram Parallel Coordinates Histogram Alluvial Diagram Dot Map

Browse By Topic

  • Visualization

    Seeing data

  • Maps

    Seeing geographic data

  • Infographics

    Explaining data

  • Networks

    Connecting data

  • Statistics

    Analyzing data

  • Software

    Working with data

  • Sources

    Getting data

  • Design

    Making data readable

Made by FlowingData

  • The Process

  • Data Underload

  • Chart Everything

  • Guides

  • Books

  • Shop

  • About
  • Contact
  • Newsletter
  • LinkedIn
  • Instagram
  • Bluesky
  • RSS
Copyright © 2007-Present FlowingData. All rights reserved.