Visualization
Showing the stories in data through statistics, design, aesthetics, and code.

Why South Koreans grew taller so quickly
As a world population, we’re growing taller, but South Koreans seemed to grow…
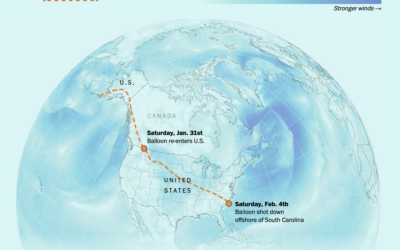
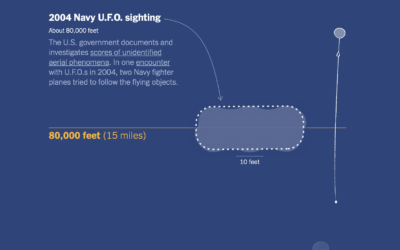
Shooting down the Chinese balloon
Shooting down a floating balloon out on its lonesome seems like a straightforward…
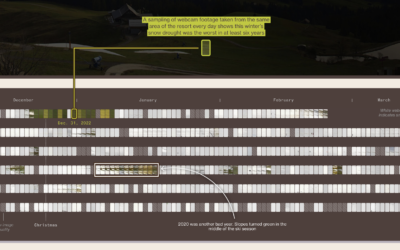
Ski resorts dealing with fewer snow days
For Bloomberg Green, Jin Wu, Laura Millan and Hayley Warren, on the challenges…
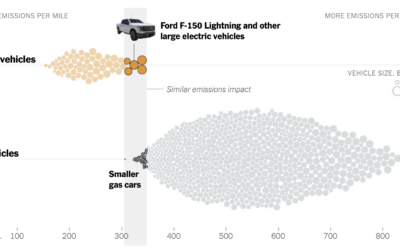
Emissions from big electric trucks vs. gas vehicles
Based on estimates from CarbonCounter by the MIT Trancik Lab, electric vehicles typically…

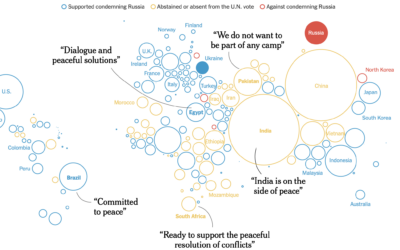
Using satellite imagery to assess the damage in Ukraine
The Economist combined two satellite imagery sources, one that estimates fire events and…
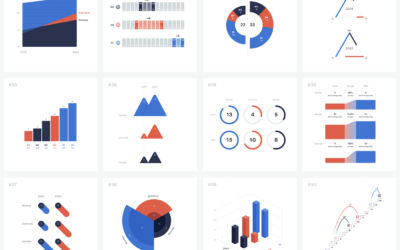
100 visualizations from a single dataset with 6 data points
The structure of a dataset can help you pick a visualization method or…

Greatest unexpected NBA performance
This is a fun one from Russell Samora and Reshad Malekzai for The…
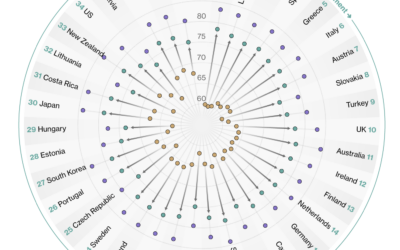
Countries with the longest healthy retirements
Bloomberg compared retirement years in the context of life expectancy and healthy life…
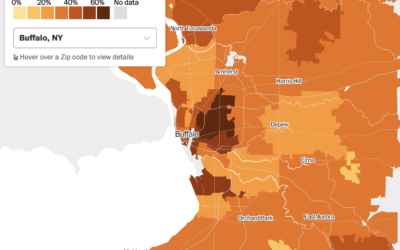
Map of homes bought with all cash
For The Washington Post, Emmanuel Martinez, Kevin Schaul and Hamza Shaban mapped the…

Cyanotype to represent grief
Marking the third anniversary of the first Covid deaths in the United States,…
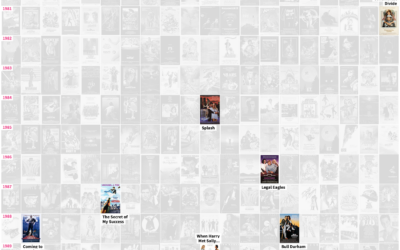
Tour of romantic comedies through the decades
In celebration of the most romantic day of the year that is sometimes…
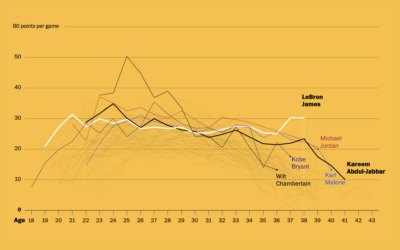
LeBron James’ longevity
Okay, one more LeBron James thing, mostly because I like seeing different looks…

Search and rescue after an earthquake, illustrated
After a big earthquake, such as the 7.8 that hit Turkey and Syria,…
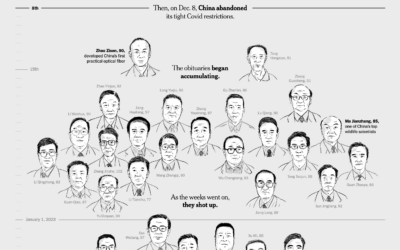
Inferring the scale of China’s Covid spike through obituaries
China reported 80,000 Covid deaths since lifting restrictions in early December 2022. But…
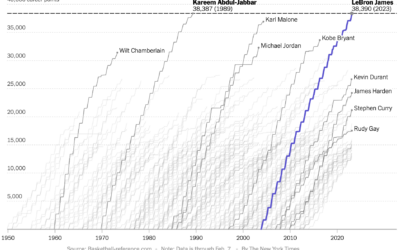
Cumulative points scored by LeBron James and other top scorers
Never fear, Sopan Deb, K.K. Rebecca Lai, and Eve Washington, for The New…

All of LeBron James’ career points, animated by season
All The King’s Buckets. pic.twitter.com/lzIultYSee
— Kirk Goldsberry (@kirkgoldsberry) February 8, 2023
LeBron…