Visualization
Showing the stories in data through statistics, design, aesthetics, and code.

Non-abstract Curry shot chart
Stephen Curry of the Golden State Warriors scored 50 points in game 7…


Switching to electric school buses
For Bloomberg, Zahra Hirji and Denise Lu on the electrification of the national…
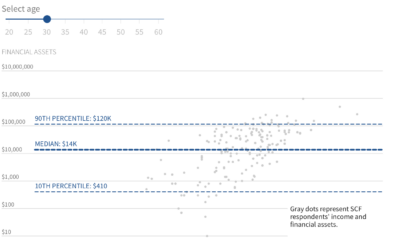
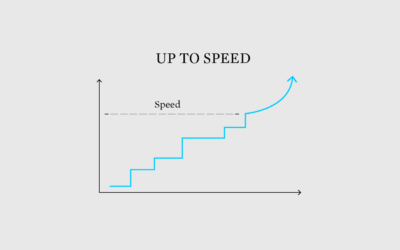
How little we save for retirement
Saving for retirement is a slow process with an end goal that can…
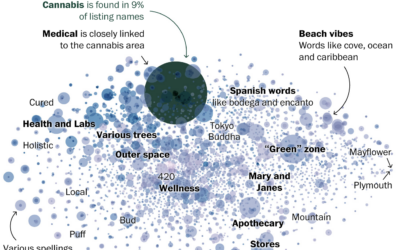
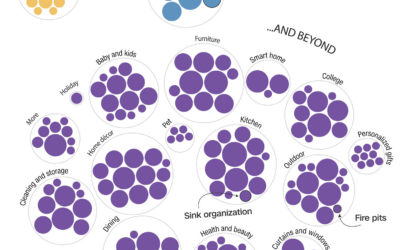
Words used in cannabis business names
Daniel Wolfe for The Washington Post looked at the similar word choices across…
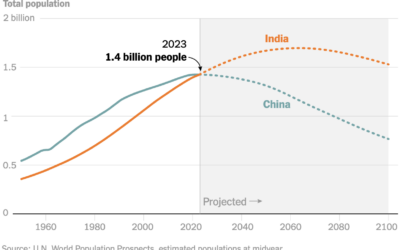
India estimated to pass China in population
Based on the United Nations’ world population report, it is estimated that India’s…

An illustrated tour of the skies in an elevator
Neal Agarwal is up to his wonderful ridiculousness again. Imagining an elevator that…
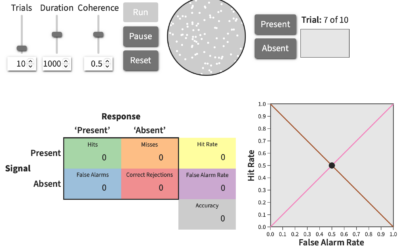
Explorable explanation for signal detection theory
When you have a lot of noisy data, it can be helpful to…

Scale of flying animals
A straightforward lineup of animals that fly provide a sense of scale, from…
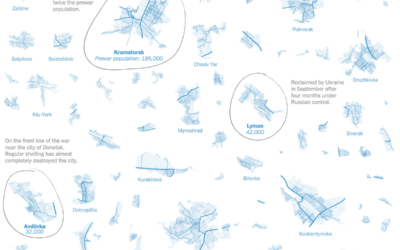
Areas still controlled by Ukraine
For The New York Times, Josh Holder and Marco Hernandez show the areas…
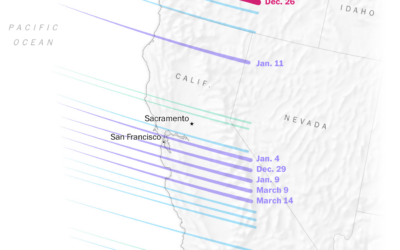
Science behind California rains
It rained a lot more than usual this winter in California. Diana Leonard…
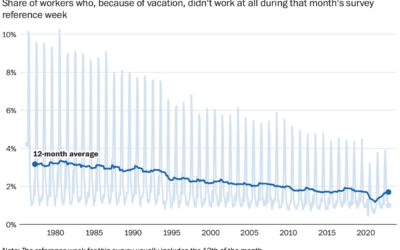
Declining vacation time from work
Despite available vacation days, it appears that American workers are taking less and…
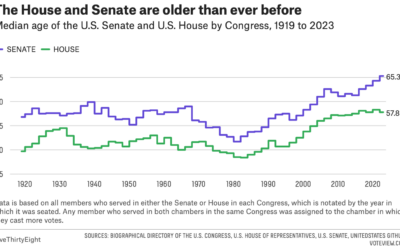
Congress still getting older
For FiveThirtyEight, Geoffrey Skelley digs into the ongoing trend:
What’s behind these increasingly…
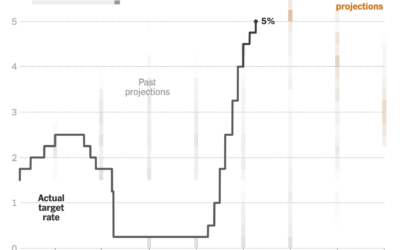
Changing Fed projections
This clever chart by Lazaro Gamio shows changing interest rates set by the…
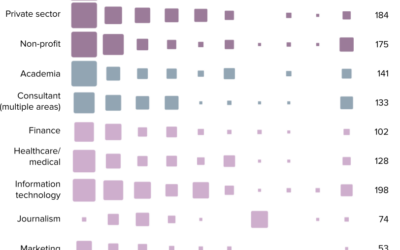
Data Visualization State of the Industry, 2022
The 2022 results from the State of the Industry survey, run by the…