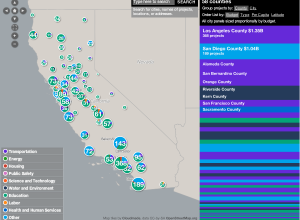
As you know, states have received billions of dollars of federal stimulus funding.…
Maps
Intuitive to look at spatial patterns and great for distributing geographic data.
-
Stimulus Funding Map is ‘Slick as Hell’
-
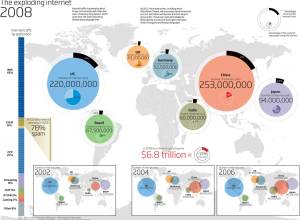
Mapping the Growth of the Internet – What Do You Think?
I, uh, well. Hmm. Yeah. New Scientist recently compiled a list of visualizations…
-
What DC Metro Routes are Most Common?
Greater Greater Washington maps rider flow for the DC Metro. As you might…
-
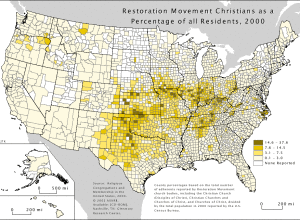
Religious Geography of the United States
The U.S. Census Bureau doesn’t ask questions about religion because of political issues…
-
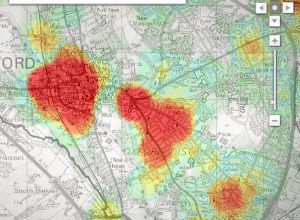
Mapping Crime in Oxford Over Time
Mentorn Media and Cimex Media, on behalf of BBC, explore crime patterns in…
-
Watch the Ebb and Flow of Melbourne Trains
Similar to other visualizations showing location (e.g. Cabspotting, Britain From Above), this one…
-
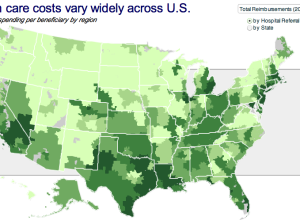
Health Care Costs Vary Widely By Region
No, this isn’t a bad fungus spreading northwest towards Washington. This map from…
-
Realtime Information Graphics Show International Data Interchange
Zum Kuckuck, a design group in Germany, visualizes data interchange and network traffic…
-
Abortion Rates in the United States, 1970-2005
I’ve been working on my mapping skills lately in preparation for the first…
-
World Map of Social Network Dominance
Vincenzo Cosenza maps social network dominance around the world according to traffic data…
-
Worldwide Obama Buzz Visualized
In celebration of Barack Obama’s 100th day as the 44th President of the…
-
Indieprojector Makes it Easy to Map Your Geographical Data
Axis Maps recently released indieprojector, a new component to indiemapper, their in-development mapping…
-
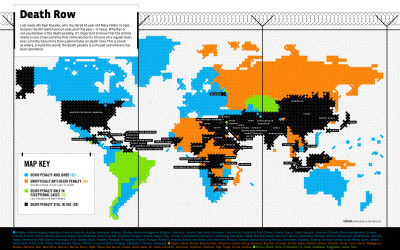
Death Penalty Laws Around the World
With their usual flare, GOOD Magazine maps the death penalty around the world…
-
Maps of the Seven Deadly Sins
Geographers from Kansas State University map the spatial distribution of the seven deadly…
-
Here & There: Horizonless Perspective of Manhattan
Jack Schulze provides this horizonless view of Manhattan:
Here & There is a… -
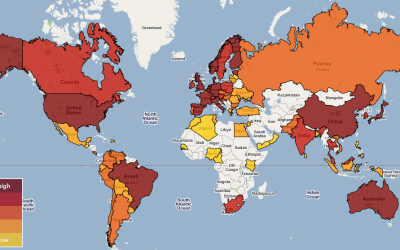
Is Your Country Involved in Open Source?
Red Hat, an open source leader best known for their Linux distribution, maps…
-
Visualizing the United States Power Grid
NPR provides an in depth view of the U.S. electric grid, exploring the…
-
Jobs Vanish Across Our Country
As a nation, we gained jobs every month during 2007 compared to the…


 Visualize This: The FlowingData Guide to Design, Visualization, and Statistics (2nd Edition)


