For the Washington Post, Travis M. Andrews, Jeremy B. Merrill, and Shelly Tan…
Infographics
Telling stories with data and graphics.
-
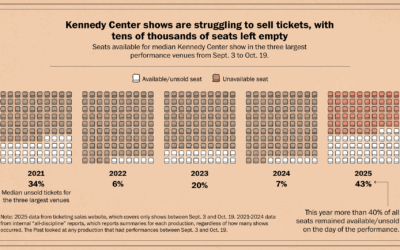
Big drop in Kennedy Center ticket sales
-
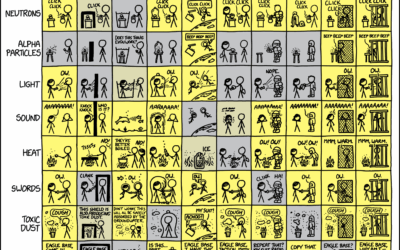
xkcd shielding vs. forces matrix
Various shields are designed to block specific forces or mechanisms. For example, armor…
-

Cartography of generative AI
It’s very easy to ignore what happens before and behind-the-scenes when you enter…
-
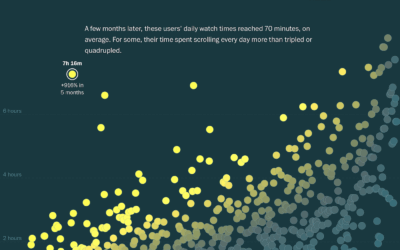
Analysis of TikTok usage, transforming new users to power users
As many of us have learned first-hand, TikTok (and its scrolling video ilk)…
-
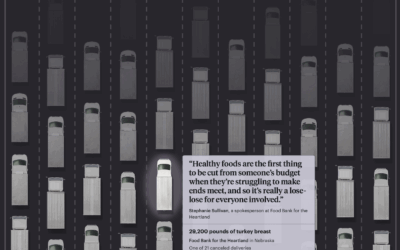
Millions of pounds of canceled food aid in the US
The administration cut $500 million of aid to U.S. food banks earlier this…
-
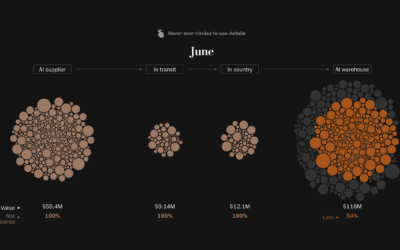
Undelivered USAID medical supplies and medicine
Earlier this year, the administration halted USAID shipments of antimalarial and HIV medical…
-
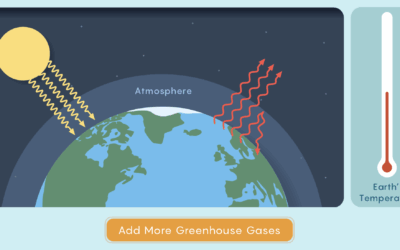
Quantum mechanics of greenhouse gases
For Quanta Magazine, Joseph Howlett and Mark Belan explain the mechanics of how…
-

Visual story about getting scammed into scamming
This is quite a visual story from Reuters. In a comic format, they…
-
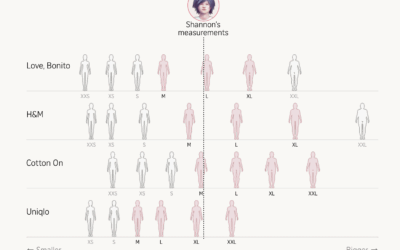
Inconsistent women’s clothing sizes across brands
Women’s clothing sizes aren’t the same across brands. The Straits Times collected measurements,…
-
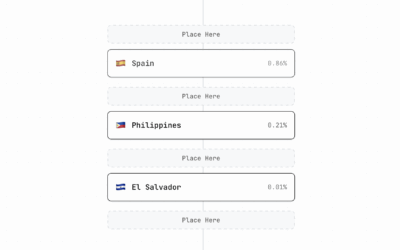
Sorting data, the quiz game
Speaking of data games, Dataguessr by David Bauer is a sorting game that…
-
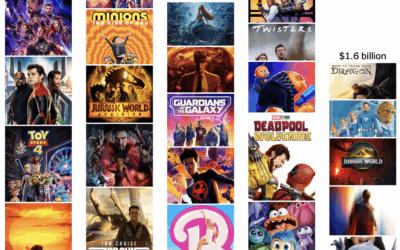
Shrinking box office
This summer was supposed to be a return to pre-pandemic levels of movie-going,…
-
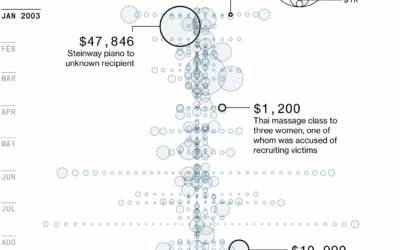
Epstein inbox and a spreadsheet of gifts
Bloomberg gained access to an email cache from Jeffrey Epstein’s Yahoo Mail inbox,…
-
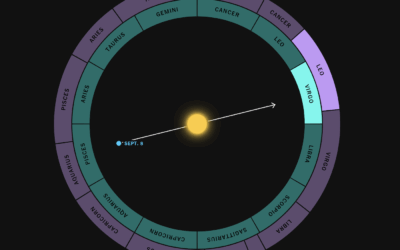
Out of date Zodiac signs, visually explained
For NYT’s the Upshot, Aatish Bhatia, Francesca Paris, and Rumsey Taylor show how…
-
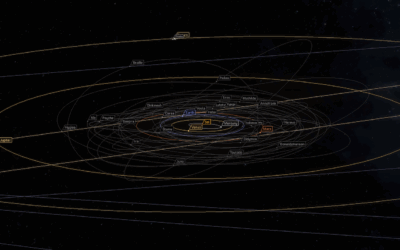
Atlas of Space
Gordon Hart put together a fun interactive atlas of space. Click on objects,…
-
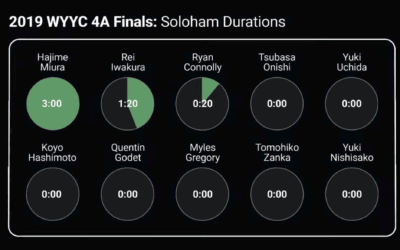
Breaking competitive yo-yo
Soloham is a yo-yo style where there are two yo-yos off the string.…
-

Optimized onion cutting for the most uniform dice
For the Pudding, Andrew Aquino, with Russell Samora and Jan Diehm, supplies interactive…
-
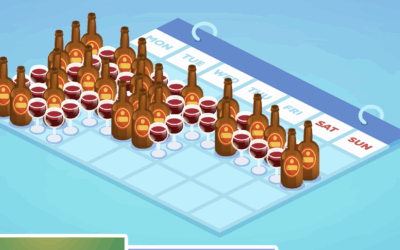
Alcohol is amazing and also terrible
We know that alcohol is not the healthiest beverage to consume. When abused,…
-

Heat in prison cells
Reuters highlights unsafe temperatures in prison cells, using building models, public records, and…
Recently for Members
Second Edition
 Visualize This: The FlowingData Guide to Design, Visualization, and Statistics (2nd Edition)
 Visualize This: The FlowingData Guide to Design, Visualization, and Statistics (2nd Edition)
New tools, refined process.
Browse by Chart Type See All →


