I’m sure you know this already, but just in case, air particles come…
Infographics
Telling stories with data and graphics.
-

Infrared to show air particles from your talk hole
-
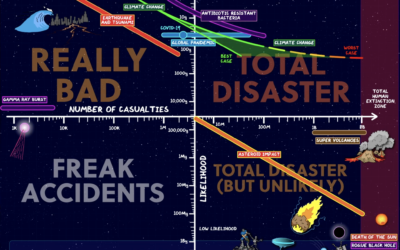
Charting and ranking apocalyptic events
[arve url=”https://www.youtube.com/watch?v=Htf0XR6W9WQ” loop=”no” muted=”no” /]
For Domain of Science, Dominic Walliman attempts to… -

Bill Nye on masks, with a map and some props
Talking about the effectiveness of masks on TikTok, Bill Nye uses a map…
-
Interactive explainer for how cameras and lenses work
We use our cameras all of the time, and it almost seems like…
-

Your place in the vaccine line
Using estimates from the Surgo Foundation and Ariadne Labs, Stuart A. Thompson for…
-

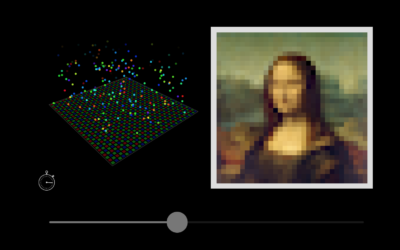
Fake faces created by AI and where this might be headed
It’s grown easier and easier to generate fake faces with AI. For The…
-

Why small gatherings can be dangerous too
A small gathering of 10 people or fewer can seem like a low-risk…
-
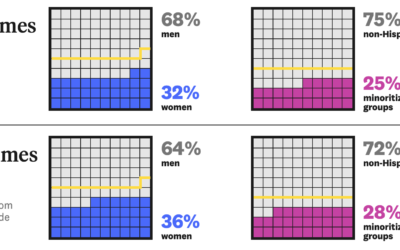
Analysis of representation in crossword puzzles
For The Pudding, Michelle McGhee analyzed representation in crossword puzzles. Some crossword publications…
-

Votes that won the presidency
Voter turnout this election was higher than it’s been in a long time,…
-
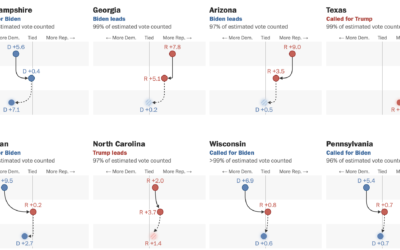
Swings in the battleground states
For The Washington Post, Ashlyn Still and Ted Mellnik show the shifts in…
-
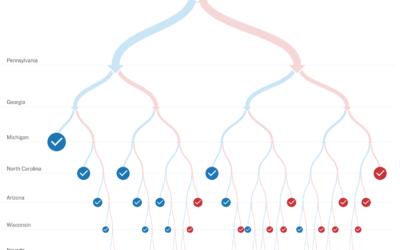
Testing voting scenarios while we wait for the counts
As we wait for the votes to be counted in the remaining states,…
-
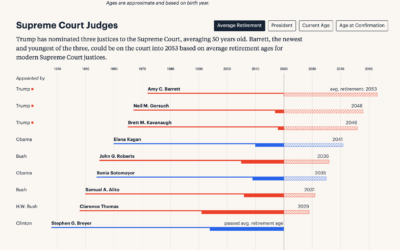
Long-term timelines for judicial appointments
Federal judge appointments are for a lifetime, so the younger a judge is…
-

How masks work to filter out particles
Masks are effective in slowing down the spread of the coronavirus. The New…
-

Illustrations show how to reduce risk at small gatherings
Risk of coronavirus infection changes depending on the amount of contagious particles you…
-
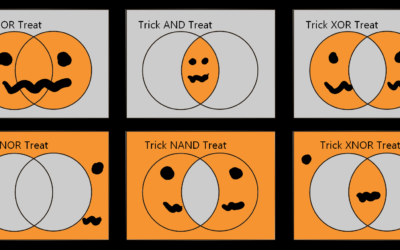
Halloween logicals
From Kaz Miyamol, these Venn diagrams present very important information about Halloween.…
-

Lifelines
Using estimates from a report by the Well Being Trust and the Robert…
-

Visual tour through the technology hype cycle
The Gartner hype cycle is a graphical representation of where certain technologies are…
-

Reconstructing protests in Minneapolis using hundreds of livestreams
From a distance, it’s difficult to build an understanding of the scale and…
Recently for Members
Browse by Chart Type See All →


Browse By Topic
Get the Book
 Visualize This: The FlowingData Guide to Design, Visualization, and Statistics
 Visualize This: The FlowingData Guide to Design, Visualization, and Statistics
Available now.