Stamen Design, whose work you’ve most definitely seen, comes out with their most…
Data Art
Finding the beauty in numbers.
-
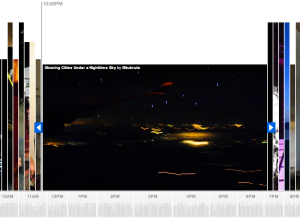
Explore Flickr Videos On Flickr Clock by Stamen Design
-
Nokia Collaborates With Generative Artists for Beautiful Interactive Pieces
In collaboration with generative artists Marius Watz, field, and others, along with Universal…
-
Microsoft’s Vision for 2019 is Data Visualization
Google’s chief economist tells us statistician will be the sexy job of the…
-
The Universe in 2009 from Seed Magazine
Seed Magazine, a publication dedicated to cool things in science, give us The…
-
George Dubya Bush Bull’s-eye
Linda Eckstein sent this graphic along to show the main ideas of Russ…
-
Showcase of Student Personal Annual Reports
Some of the best stuff comes out of student projects. During the Screendesign…
-
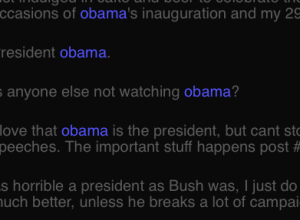
Twistori for the Inauguration
Remember Twistori? It’s the Twitter mashup that shows tweets of love, hate, think,…
-
Fun With Words that Collectively Make Pictures
People have fallen in love with word clouds that make pictures. Zoom in…
-
Sculptural Data Visualization – Stock Market and GDP
In his latest data sculptures, Andreas Nicolas Fischer places data visualization in a…
-
Typographic Illustration for Jay-Z’s ‘Brooklyn Go Hard’
Evan Roth from the Graffiti Research Lab, uses typographic illustration in Jay-Z’s music…
-
Visualization Projects from Database City – Visualizar’08
This is a guest post by Greg J. Smith, a Toronto-based designer and…
-
Explore Your Feeds in a Cloud of Posts – RSS Voyage
I’m not exactly sure what I’m seeing here, but Voyage, by Andy Biggs,…
-
Mmm, Chocolate Pie… Chart
In the spirit of turning pie charts into food, Mary and Matt kick…
-
Word Portraits of Famous People – Einstein and Ginger the Cockapoo
Jeff Clark of Neoformix has been doing some cool stuff with words lately.…
-
Showing This Many Per Second – Data Humanized
I’ve always thought one of the best ways to make data relate-able is…
-
A Bunch of Japanese Women’s Bra Responses
Uniqlo gathered hundreds of responses from a couple hundred Japanese women about bra…
-
Daily Design Workout – DONE by Jonas Buntenbruch
DONE is a sketching project by Jonas Buntenbruch. He takes 30-60 minutes per…
-
Doodle Your Way Through the News – DoodleBuzz
I feel like I’ve been seeing and writing a lot about artistic visualization…


 Visualize This: The FlowingData Guide to Design, Visualization, and Statistics (2nd Edition)


