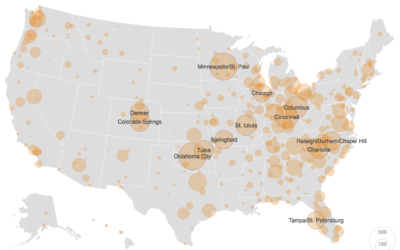
A challenge of using geographic maps to show data is that larger regions…
Software
Programs and online applications to help you make use of data.
-
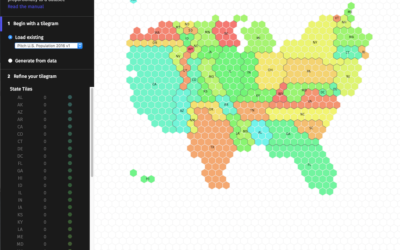
Make your own tiled cartograms
-
Comma Chameleon, a stripped-down CSV editor
CSV files are great, but every now and then you have to edit…
-
D3 in Depth
D3 is the most commonly used JavaScript library for visualization on the web,…
-
Colorgorical generates color schemes for you
Sometimes you need a color scheme quick, and ColorBrewer is typically the de…
-
Practical tips for scraping data
It’s an unpleasant feeling when you have an idea for a project and…
-
R in the data journalism workflow at FiveThirtyEight
R has found its way into a good number of news groups who…
-
D3 4.0 released
I typically don’t care much about code releases, but every interactive chart I…
-
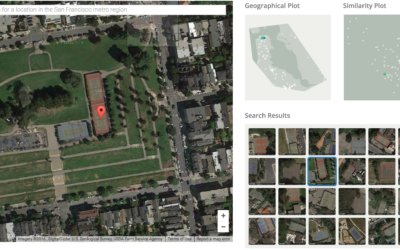
Visual search tool for satellite imagery
Terrapattern is a fun prototype that lets you search satellite imagery simply by…
-
Link
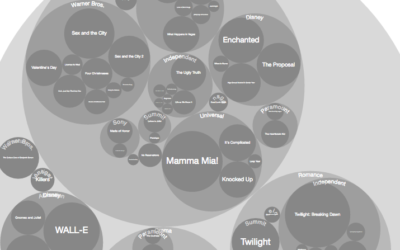
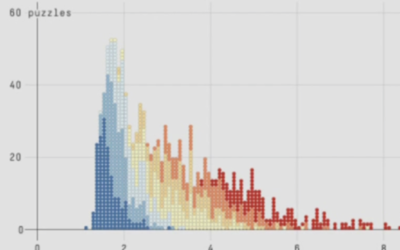
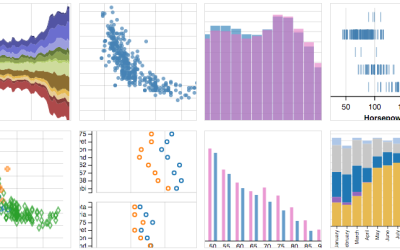
One Chart, Twelve Tools →
Using a bunch of different tools to visualize the same dataset in a similar way.
-
Link
Animate gradient to imitate flow with d3.js →
Gain a sense of direction from otherwise static connections.
-
Link
d3.geo.statePlanes →
Nice projections for US states in D3.
-
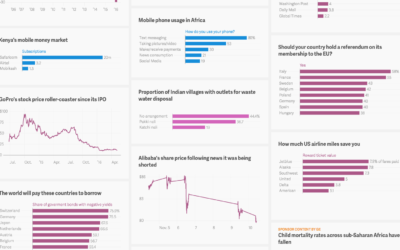
Quartz Atlas opening up to creators
Last year Quartz announced Atlas, which was a place to find all of…
-
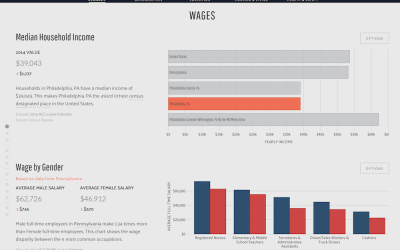
Data USA makes government data easier to explore
Government data is, shall we say, not the easiest to use and look…
-

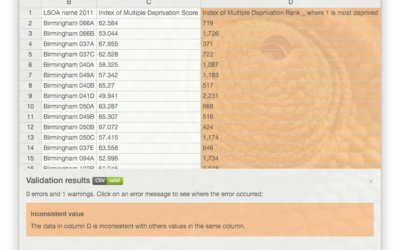
Data Proofer automates the data checking process
Data checking is a pain and can be what stands between you and…
-
Link
What Makes Software Good? →
Thoughtfulness in design from d3.js maker Mike Bostock. One of the main reasons I go with d3.js over other libraries.
-
Screen-capping Google Maps for traffic
Alyson Hurt quickly wrote some code to take screen captures of a Google…
-
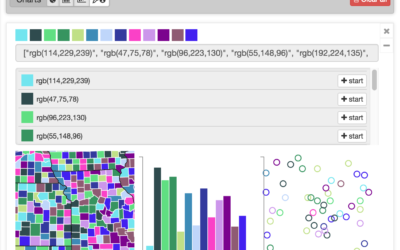
Vega-Lite for quick online charts
A few years ago, Trifacta released Vega, a “visualization grammar” that lets you…
-
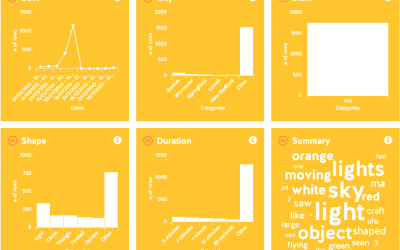
Suite of data tools for beginners, focused on fun
Data can be intimidating and confusing for beginners, and as a result they…
-
Link
How do you learn d3.js? →
Small projects. Decide what you want to make first, and then figure out how to do it.
-
Link
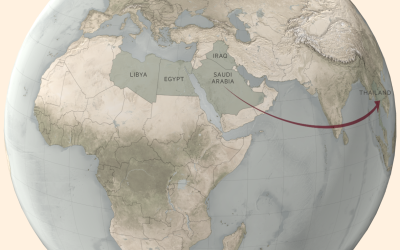
Experimentation with globes in Blender 3D →
There’s also a collection of video tutorials on how to use QGIS to greater effect.
Recently for Members
Second Edition
 Visualize This: The FlowingData Guide to Design, Visualization, and Statistics (2nd Edition)
 Visualize This: The FlowingData Guide to Design, Visualization, and Statistics (2nd Edition)
New tools, refined process.
Browse by Chart Type See All →


