My many thanks to the FlowingData sponsors. I had to upgrade my server…
Nathan Yau
-
FlowingData is brought to you by…
-
Link
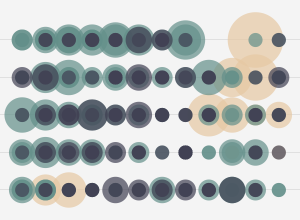
HBO Recycling Program →
Actors who have been in three or more episodes of an HBO original series
-
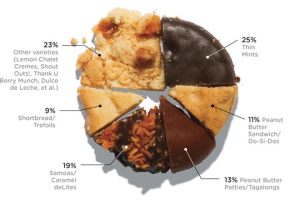
Girl Scout cookie pie chart
With Girl Scout cookie season around the corner, Wired pies it up with…
-

Cost of 9/11
This Sunday will be 10 years since the attacks on September 11. Amanda…
-
Classroom seating habits
In college, I was one of those guys who sat in the back…
-
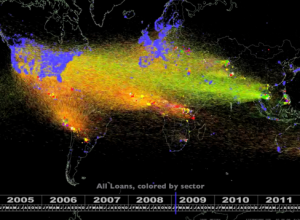
Five years of Kiva lending and borrowing
Kiva, the microfinance site, lets you give small loans to people around the…
-
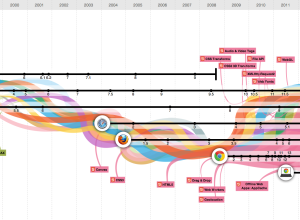
Evolution of the Web
In celebration of Chrome’s third birthday, Google teamed up with Hyperakt and Vizzuality…
-
Best of FlowingData – August 2011
I know most of you have checked out mentally for Labor Day weekend,…
-
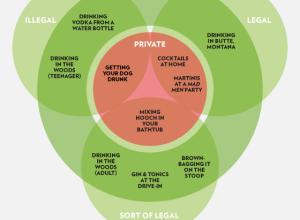
How to drink in public the right way
In case you’re wondering whether you should be drinking in that local park…
-

Cartoon color wheel
Slate places cartoon characters from past and present within the frame of a…
-
Teaching math with context and applications
Most of us have gone through the paces of algebra through calculus in…
-
Geo API from Infochimps brings you closer to mapping fun
Mostly because of the popularity of smartphones, location data is all the rage…
-
Why one death is more moving than a million
We read the story about the suffering of an individual, and we’re moved.…
-
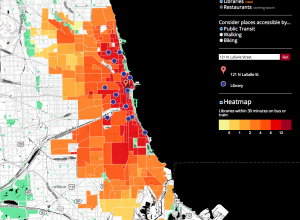
Getting around Chicago in 30 minutes or less
When you’re deciding on a place to live in a new place, it’s…
-
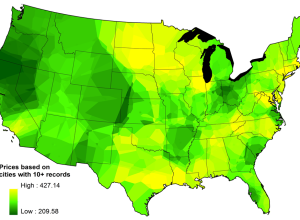
Price of weed
I was raised to always find the best deal whenever I bought anything.…
-

Reporters make it easier to access Census data
Census data can provide valuable information, but the datasets are not always the…
-

Open thread: Is it OK to confuse if that’s the message?
Earlier this week we saw two versions of mobile patent lawsuits. The original…
-
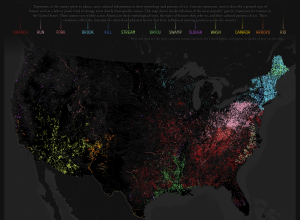
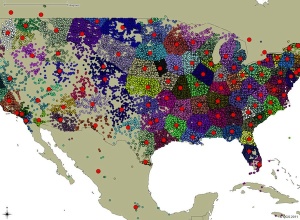
Generic terms for streams mapped
The names of places can say a lot about a geographic area. Derek…
-
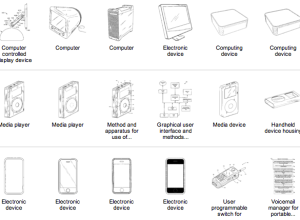
Steve Jobs patents
Steve Jobs stepped down as CEO of Apple yesterday, and one of the…
-

Who owns the beer
When you walk the beer aisle at the grocery store, there are lots…
Recently for Members
Second Edition
 Visualize This: The FlowingData Guide to Design, Visualization, and Statistics (2nd Edition)
 Visualize This: The FlowingData Guide to Design, Visualization, and Statistics (2nd Edition)
New tools, refined process.
Browse by Chart Type See All →


