The moments leading up to a marriage proposal can be both exciting and…
Nathan Yau
-
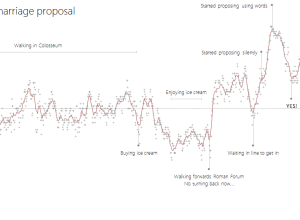
Heartbeat during marriage proposal
-
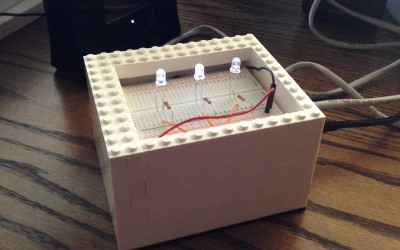
How to Download and Use Online Data with Arduino
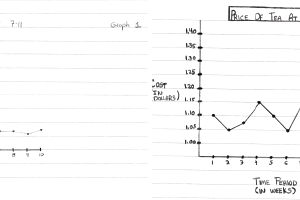
Before you can do anything with data, you have to get it into the application. Working with an Arduino is no different. Although the process is changes, if you’re used to working with desktop software.
-

Physical infographics
Photographer Marion Luttenberger used physical objects and people as her visual cues in…
-

Book genres for visualization
Martin Wattenberg and Fernanda Viegas from Google Research ran with the book metaphor…
-
Data-ish physical gift things
Gift-buying season is in full swing, and it’s time to get stuff for…
-
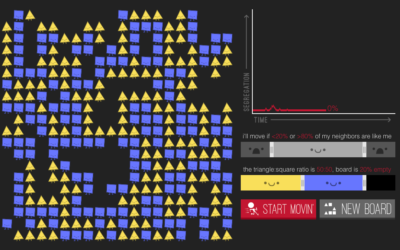
Understanding segregation with a simulation
In 1971, Nobel laureate economist Thomas Schelling proposed that a desire to have…
-
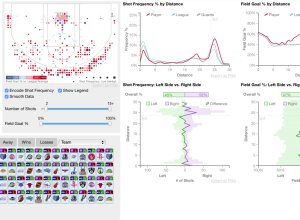
Detailed visualization of NBA shot selection
Sports loves conditional distributions. What does Joe Billy Bob typically do against such…
-
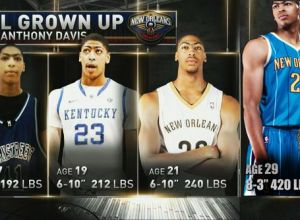
Player shows tremendous growth towards Godzilla
TNT described NBA player Anthony Davis’ growth and accompanied the discussion with a…
-
Baseline matters
Sweet, I guess Fox News had it right all along. I’m going to…
-
Make your own detailed tweet maps
Eric Fischer, known around these parts for his detailed dot maps, describes his…
-
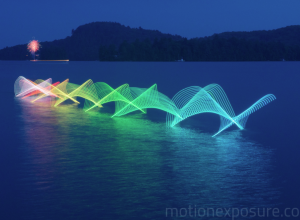
Motion Exposure →
Motion Exposure, a photography project by Stephen Orlando, captures movement patterns with light.…
-

Map print clothing
Monochome, a new service brought to you by Rachel Binx, lets you make…
-
Serial views
Like many, I’ve been listening to Serial every week, but I always just…
-
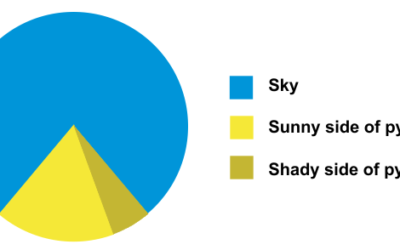
Pie chart pyramid
This pyramid pie chart just might take the pie chart humor crown from…
-

Cyber Monday Sale at the FlowingData Shop →
For today only, everything, and I mean everything (all THREE items) is on…
-
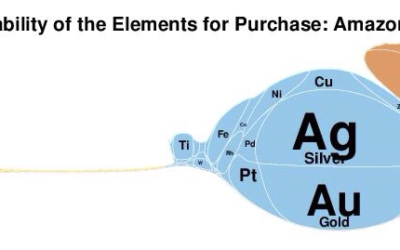
Elemental cartograms
Along the same lines as the scaled Periodic Table, Elemental Cartograms by chemistry…
-
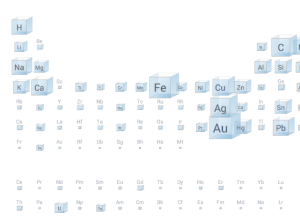
A scaled Periodic Table of Elements
Inspired by a diagram from 1976, the Big Picture group at Google Research…
-
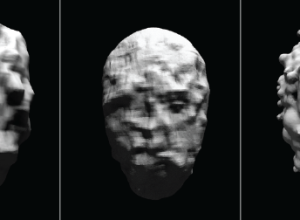
Detecting your face
Sterling Crispin reverse engineered facial recognition algorithms and produced masks that only kind…
-
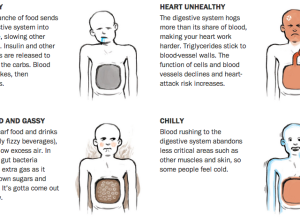
Why you feel bloated after holiday meals →
Because that’s what happens when you eat ten full plates of turkey and…
-
Friends in Space
Part celebration of Samantha Cristoforetti, the first Italian woman to fly into space,…
Recently for Members
Second Edition
 Visualize This: The FlowingData Guide to Design, Visualization, and Statistics (2nd Edition)
 Visualize This: The FlowingData Guide to Design, Visualization, and Statistics (2nd Edition)
New tools, refined process.
Browse by Chart Type See All →


