Hannah Fairfield, who does graphics at the New York Times, talks about using…
Nathan Yau
-
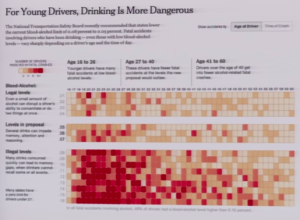
Power of the reveal
-
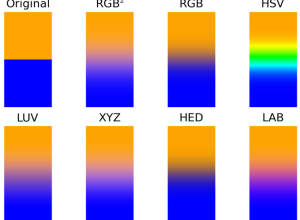
Testing broken computer colors
Computers can calculate an infinite number of colors, but our brains can only…
-
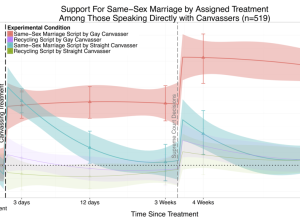
Graduate student makes up data for fake findings
Last month, This American Life ran a story about research that asked if…
-
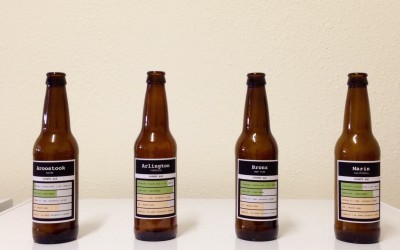
Brewing Multivariate Beer
I was toying around with the idea of multivariate beer, where the ingredients varied by county demographics. Could I taste the difference? Here’s how the experiment went.
-
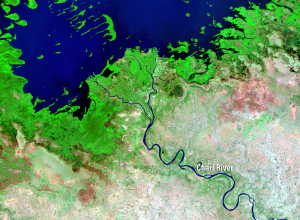
Satellite time-lapse shows changes on the ground
Since the 1970s, NASA has used satellites to take pictures of the Earth’s…
-
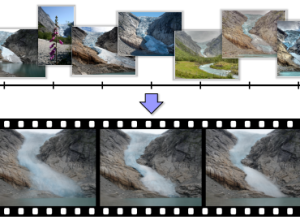
Time-lapse using photos online
Think of time-lapse photography, and you imagine someone sets up a camera in…
-

Running through digital particles
Force of Nature by FIELD is a running installation commissioned by Nike. It…
-
Upgraded self, but there’s a catch
With wearables and cheaper and advancing tech, the how part of personal data…
-
Link
mapturner →
“A command line utility for generating topojson from various data sources for fast maps.” Useful for use with D3.
-
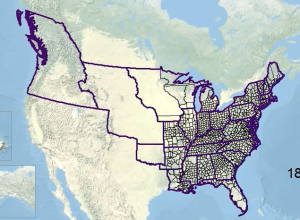
Animated history of US county boundaries
Here’s a straightforward animation that shows US county boundaries change between 1629 and…
-
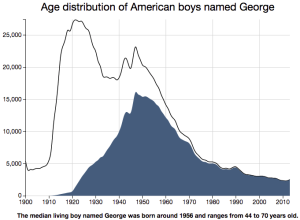
Estimated age based on your name
A while back, Nate Silver and Allison McCann for FiveThirtyEight estimated age based…
-

Data as a verb
As in, you data me, I data you, and they data us. Jer…
-
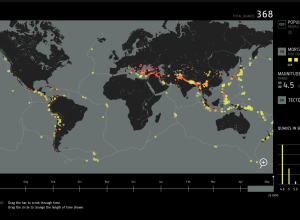
A year of earthquakes
Fathom provides an interactive browser for a year of earthquakes, based on data…
-
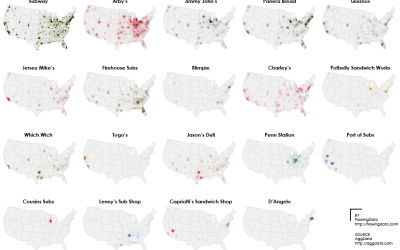
Sandwich Place Geography
Subway dominates the sandwich chains.
-
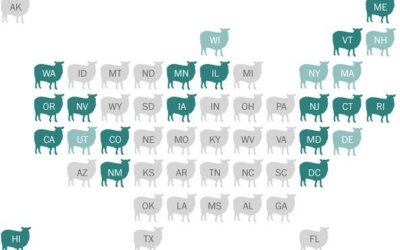
The Great Grid Map Debate of 2015
There’s been a sudden bump in grid maps lately taking the place of…
-
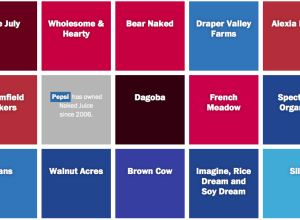
The big companies behind organic food brands
When you walk down the aisles of the grocery store, there are probably…
-
Illegal to collect environmental data in Wyoming
Wyoming just passed a law that makes it illegal to collect data about…
-
#DrunkTufte
There were some blips on Twitter last week for the DrunkTufte hashtag for…
-
Problems with algorithmic policy-making
Virginia Eubanks for Slate describes the dangers of relying too heavily on black-boxed…
-

Visualization is growing up
For a while, somewhere in between 2007 and 2011, infographics — in the…
Recently for Members
Second Edition
 Visualize This: The FlowingData Guide to Design, Visualization, and Statistics (2nd Edition)
 Visualize This: The FlowingData Guide to Design, Visualization, and Statistics (2nd Edition)
New tools, refined process.
Browse by Chart Type See All →


