It’s an unpleasant feeling when you have an idea for a project and…
Nathan Yau
-

Practical tips for scraping data
-
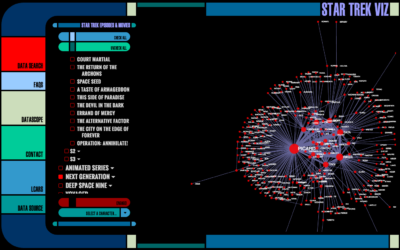
Star Trek character network
Star Trek fans rejoice. Mollie Pettit from Datascope Analytics visualized the interactions between…
-

An interactive look at handwriting recognition from 1960s
In the 1960s, the RAND corporation developed a handwriting recognition system using, well,…
-
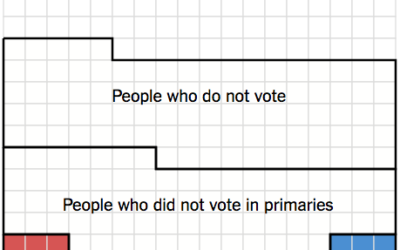
Small percentage of Americans actually picked Clinton and Trump
Alicia Parlapiano and Adam Pearce for the New York Times elegantly show a…
-

One-year time-lapse of Earth
Time-lapse from space by NASA:
On July 20, 2015, NASA released to the… -

Continental drift, from 240 million years ago to present
Researchers modeled continental drift, going back 240 million years ago, on the scale…
-

What That Election Probability Means
You’re going to see probability values mentioned a lot these next few months. Many people will misinterpret. But not you.
-

Camera really adds tens pounds
Photographic evidence.
-
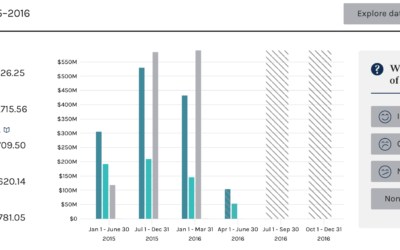
Searchable campaign finance data from the FEC
Every four years, campaign finance data from the Federal Election Commission peeks its…
-
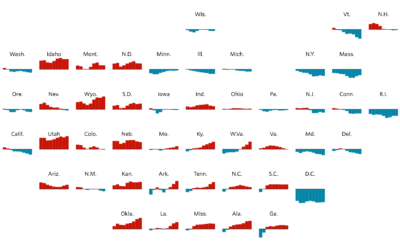
Grid map shows shifting states
You’re likely familiar with the state grid map form used these days. Instead…
-
Guide to spotting data BS
As we delve deeper into election season, politicians will spit out more and…
-

Ride on the VR time series roller coaster
Speaking of virtual reality visualization, this Nasdaq roller coaster by Roger Kenny and…
-

Virtual reality map to show Google Trends
More of an experiment, this VR map, by the Google Trends Lab in…
-

Grace Hopper explains a nanosecond with a visual aid
A nanosecond is a billionth of a second, but we’re not very good…
-
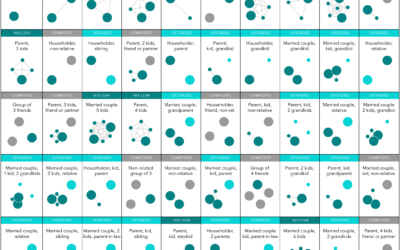
Most Common Family Types in America
Nuclear is still the most common, but there are millions of households in the United States with a different family structure.
-

Piecing together satellite images
You might think piecing together satellite imagery is a straightforward task of lining…
-
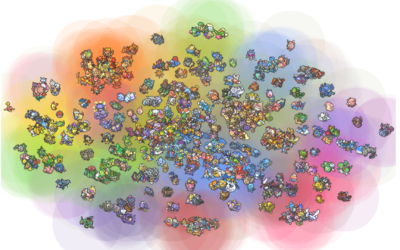
Charting all the Pokemon
Pokemon is everywhere these days. I think it’s just something the world really…
-
Members Only

How to Make Square Pie Charts in R
Instead of traditional pie charts that rely on angles and arc lengths to show parts of a whole, try this easier-to-read version.
-
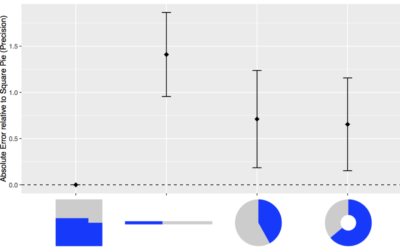
Square pie chart beats out the rest in perception study
Many hate pie charts. Others love them. I think they’re useful but have…
-

Gun deaths
As an introduction to a series on gun deaths in America, FiveThirtyEight uses…
Recently for Members
Second Edition
 Visualize This: The FlowingData Guide to Design, Visualization, and Statistics (2nd Edition)
 Visualize This: The FlowingData Guide to Design, Visualization, and Statistics (2nd Edition)
New tools, refined process.
Browse by Chart Type See All →


