From the guys who brought you 6pli and other like-minded network visualization tools,…
2008 October
-
Visualizing YouTube, Blogs, Twitter, Flickr, People…
-
Browse Political Bias on Memeorandum – Greasemonkey Script
Memeorandum shows up-to-date posts from leading political bloggers, and it is well-known that…
-

Great Data Visualization Tells a Great Story
Think of all the popular data visualization pieces out there – the ones…
-
Daily Design Workout – DONE by Jonas Buntenbruch
DONE is a sketching project by Jonas Buntenbruch. He takes 30-60 minutes per…
-
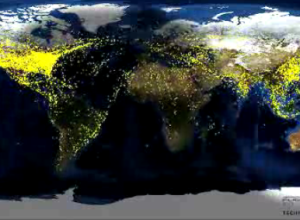
Commercial Air Traffic Seen Around the World
This computer simulation (video below) by Zhaw shows worldwide commercial flights over a…
-

May the Tallest and Fattest Win the Presidency
OPEN N.Y. put together an amusing (and informative) graphic for a New York…
-
Best of FlowingData: September 2008
September was another good month for FlowingData. We surpassed 5,000 subscribers for the…
-
Highlights from Wired NextFest in Chicago
I was in Chicago last week for Wired NextFest – it was impressive,…
-
Thank You to FlowingData Sponsors
It’s been something like a year and a half now since I started…
-
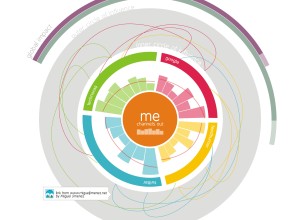
Sketching Around Personal Brand Tracking
This is a guest post by Miguel Jiménez, a user experience and interaction…
-
Maps for Advocacy – Beginner’s Guide to Mapping
In a follow up to Visualizing Information for Advocacy, the Tactical Technology Collective…
-
We Don’t Know Jack About the World – Alisa Miller TED Talk
Alisa Miller, President and CEO of Public Radio International, enlightens us on how…
Recently for Members
Second Edition
 Visualize This: The FlowingData Guide to Design, Visualization, and Statistics (2nd Edition)
 Visualize This: The FlowingData Guide to Design, Visualization, and Statistics (2nd Edition)
New tools, refined process.
Browse by Chart Type See All →


