Roger Peng and Hilary Parker started the statistics and data science podcast Not…
Statistics
More than mean, median, and mode.
-
Last episode of Not So Standard Deviations podcast
-
Marketplace for government agencies to buy all the personal data about Americans
For the Intercept, Sam Biddle reports on government plans for a one-stop shop…
-
Undisclosed surveillance with facial recognition in New Orleans
For The Washington Post, Douglas MacMillan and Aaron Schaffer report on a system…
-
Privacy from data brokers canceled
Last year, the Consumer Financial Protection Bureau proposed a new rule that would…
-
Paying attention to when we kept on living
We usually think about mortality in terms of events that happened, because it’s…
-
Farmers sued the USDA over deleted data — and it worked
In February, farmers sued the U.S. Department of Agriculture for removing data related…
-
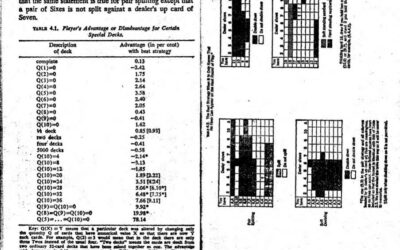
Point of view of a professional card counter
Card counting is a method to keep track of the cards left in…
-
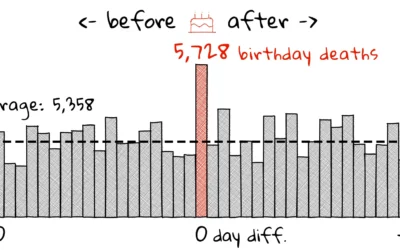
Likelihood of dying on your birthday
The birthday effect is a statistical anomaly that shows higher likelihood of death…
-
Millions could be affected by Social Security check delays
There are plans to reduce staffing at the Social Security Administration by 7,000…
-
NOAA database for extreme weather disasters cancelled
The NOAA database, dubbed Billion-Dollar Weather and Climate Disasters, tracked events that exceeded…
-
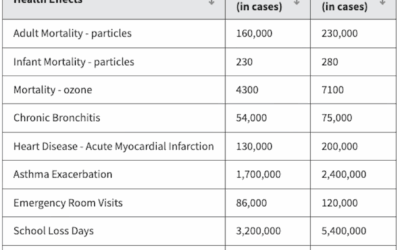
Air quality monitoring suspended at national parks
It’s a temporary suspension, for now. For the Washington Post, Maxine Joselow reports:…
-
Deportation Data Project
The Deportation Data Project, launched by a group of researchers and lawyers, is…
-
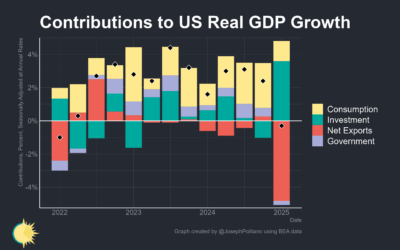
Shrinking U.S. economy after tariffs
Joseph Palitano breaks down the contribution of tariffs to the shrinking economy.
The… -
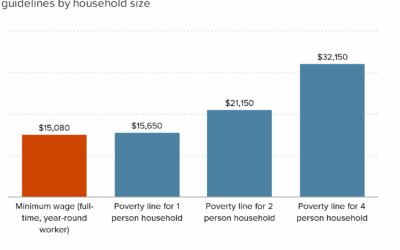
Federal minimum wage falls below poverty lines
Each year, poverty thresholds are calculated based on the cost of living, so…
-
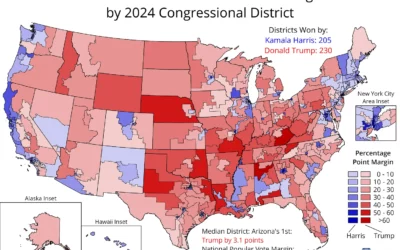
Complete 2024 election data, for congressional districts
Election data should be publicly available and easy to access at high granularity,…
-
Ignoring citizens’ privacy to build a centralized database and track people
DOGE is taking agency data in an effort to compile a master database…
-
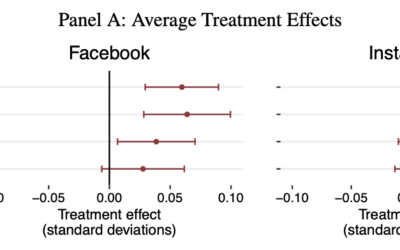
Research suggests less Facebook and Instagram is better for your emotional state
The National Bureau of Economic Research studied before-and-after effects of about 20,000 users…
-
Halt of data collection that measures American society
As data provides ways to more accurately estimate how things are going, the…
-
List of NOAA datasets to be discontinued
If you use NOAA data, now seems like a good time to download…
-

DOGE possibly extracted data from National Labor Relations Board, whistleblower discloses
DOGE engineers were at the NLRB for a week but didn’t specify what…
Recently for Members
Second Edition
 Visualize This: The FlowingData Guide to Design, Visualization, and Statistics (2nd Edition)
 Visualize This: The FlowingData Guide to Design, Visualization, and Statistics (2nd Edition)
New tools, refined process.
Browse by Chart Type See All →


