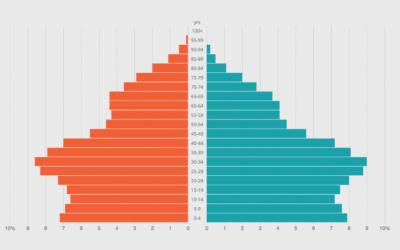
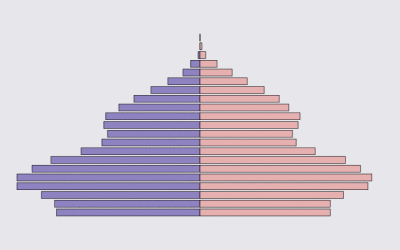
Compare distributions side-by-side with a pyramid chart. Observe the change over the years by animating it.
pyramid
-
Members Only
How to Make an Animated Pyramid Chart with D3.js
-
Members Only
How to Make an Animated Pyramid Chart in R
Make a bunch of charts, string them together like a flip book, and there’s your animation. Sometimes good for showing changes over time. Always fun to play with.
-
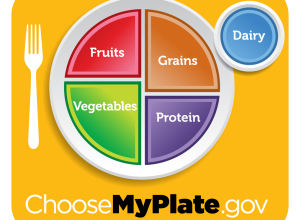
Open thread: Is the Food Plate better than the Pyramid?
In an effort to decrease obesity and improve general health, the US government…


 Visualize This: The FlowingData Guide to Design, Visualization, and Statistics (2nd Edition)


