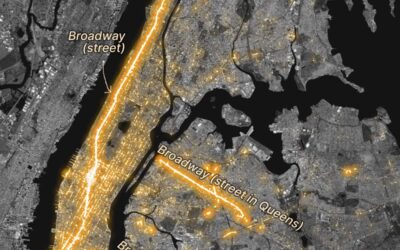
Yufeng Zhao extracted words found in millions of publicly available Google Street View…
New York
-
Analysis of all the words used on NYC streets
-
NYC subway map updated with a diagrammatic style
The Metropolitan Transportation Authority in New York is rolling out an updated subway…
-
Tracking the effects of Congestion Pricing in New York
In an effort to reduce traffic, New York launched a program that charges…
-
Shifting currents and melting ice in the Antarctic
Based on data from autonomous sensors floating in the oceans, researchers are able…
-
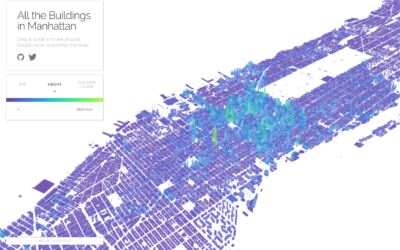
All the buildings in Manhattan in 3-D map
Taylor Baldwin mapped all of the buildings in Manhattan using a 3-D layout.…
-
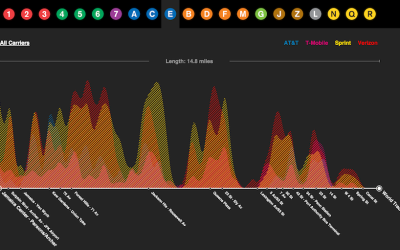
Cell reception on the subway, mapped
Daniel Goddemeyer and Dominikus Baur grew interested in cell reception while on the…
-
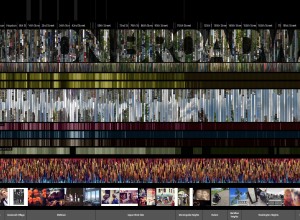
On Broadway shows city life through data cross-sections
On Broadway, by Daniel Goddemeyer, Moritz Stefaner, Dominikus Baur, and Lev Manovich, provides…
-
Bike share data in New York, animated
Citi Bike, also known as NYC Bike Share, is releasing monthly data dumps…
-
Before and after lot vacancy
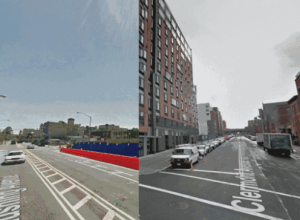
Justin Blinder used New York’s city planning dataset and Google Streetview for a…
-
Olympic events placed in New York for scale →
The New York Times published a fun piece that places Winter Olympic events…
-
Lego New York
I’m not sure what these digitally rendered Lego blocks by JR Schmidt represent,…
-
Average color of NYC skies, every five minutes
The color of the sky changes through the day and into the night…
-
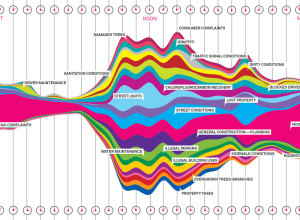
What New Yorkers complain about
Wired, in collaboration with Pitch Interactive, has a look at complaints called in…






 Visualize This: The FlowingData Guide to Design, Visualization, and Statistics (2nd Edition)


