Kevin Simler uses interactive simulations to explain how things — ideas, disease, memes…
network
-
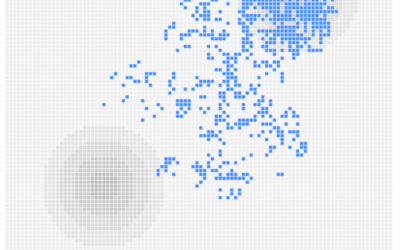
Interactive explainer for how disease and ideas spread through a network
-
Members Only
Getting Started with Network Graphs in R
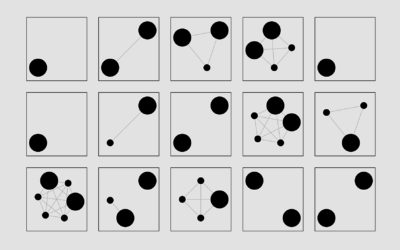
Add the vertices. Connect them with edges. Repeat as necessary.
-
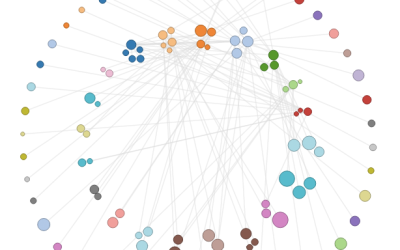
Degrees of separation between athletes from different sports
You’ve probably heard of the six degrees of Kevin Bacon. The idea is…
-
How to Make an Interactive Network Visualization
Interactive network visualizations make it easy to rearrange, filter, and explore your connected data. Learn how to make one using D3 and JavaScript.
-
Manuel Lima’s animated talk
Wow, Manuel Lima, Senior UX Designer at Bing, got through a world of…
-
Relational ornaments
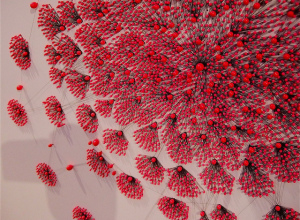
Gundega Strautmane, a Latvian textile artist and designer, visualizes social and physical networks…
-
Link
sigma.js →
JavaScript library to easily draw network graphs
-
Racial divide mapped with spacial rifts
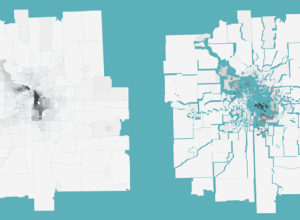
Jim Vallandingham maps racial divide in major cities using Mike Bostock’s implementation of…
-
Map of scientific collaboration between researchers
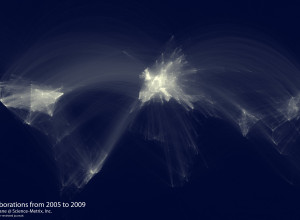
In the spirit of the well-circulated Facebook friendship map by Paul Butler, research…
-
Filling in the black holes of the Facebook friendship map
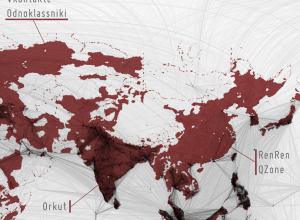
While it was fun looking at the worldwide connections on Facebook, I thought…
-
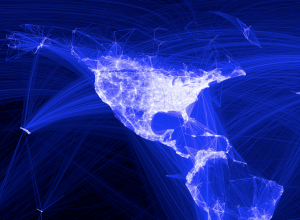
Facebook worldwide friendships mapped
As we all know, people all over the world use Facebook to stay…

 Visualize This: The FlowingData Guide to Design, Visualization, and Statistics (2nd Edition)


