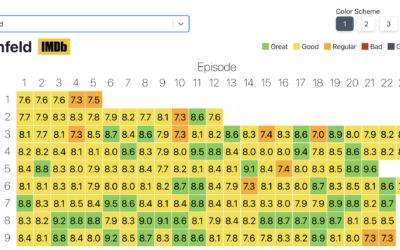
Inspired by a graphic on Reddit, Jim Vallandingham expanded the format for all…
Jim Vallandingham
-
Heatmap of average IMDb ratings for all the shows
-
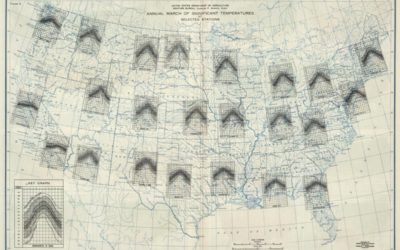
Multivariate map collection
I heard you like maps. Jim Vallandingham put together a collection of maps…
-
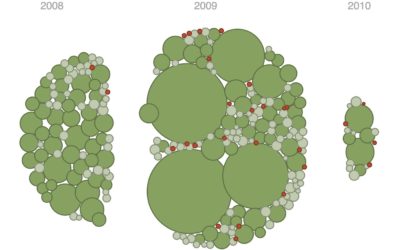
Floaty bubble charts with d3.js
D3.js, or Data-Driven Documents, version 4.0 was released a few months ago, so…
-
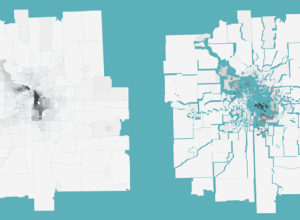
Racial divide mapped with spacial rifts
Jim Vallandingham maps racial divide in major cities using Mike Bostock’s implementation of…


 Visualize This: The FlowingData Guide to Design, Visualization, and Statistics (2nd Edition)


