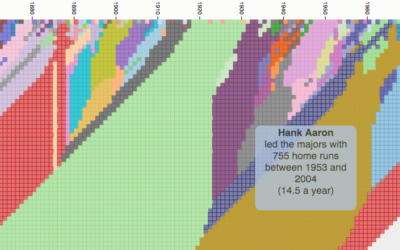
When you watch sports, it can sometimes feel like the stat guy pulls…
d3js
-
Cherry picking years for random sports statements
-
Link
D3 3.0 →
Built-in geographic projections, better transitions, and more extensive asynchronous requests
-
Link
Creating Animated Bubble Charts in D3 →
Use of Force layout, collision detection, and transitions to make this graphic from The New York Times


 Visualize This: The FlowingData Guide to Design, Visualization, and Statistics (2nd Edition)


