This week is about helping people see data for what it is and avoiding poor choices.
context
-
Members Only
Data with missing information
-
Communicating risk in the context of daily living
Wayne Oldford, a statistics professor at the University of Waterloo, explains risk in…
-
Members Only
Navigating Through the Uncertainty and Messiness of Data – The Process 179
Connecting back to the real world is how we fill in the gaps.
-
Members Only
The Process 112 – Statistics Without Awareness, Virtual Reality, and a Bar Chart Race
Look around. Take it in.
-
Members Only
Wide View (The Process 085)
The data might exist on a single page or in a single file, but there’s always more to it. Take a step outside for a better view.
-
Members Only
Less Time With Methods, More Time With Questions and Context (The Process #61)
Data represents the real world, and visualization represents data. But sometimes data and the real world disagree with each other.
-
Techniques for adding context to visualization
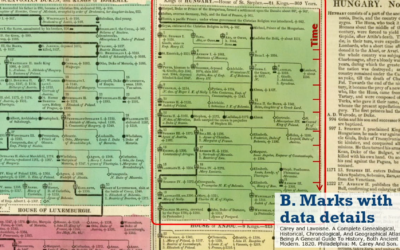
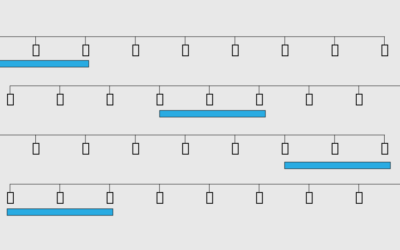
When it comes to meaningful visualization, context is everything. Richard Brath, at the…
-
Four
Got a chuckle out of me:
Me explaining why standardizing your variables is…
-
Members Only
Axis Labels, Better Than Defaults (The Process #38)
In this guide, I look maybe a little too closely at how to adjust axis labels for more readable charts.
-
GitHub is meant to track code
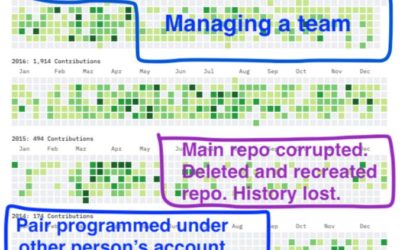
Jen Luker noted, “As amazing as @github is, it is a tool designed…
-
Finding context for the data
Context makes data useful. Without it, it’s easy to get lost in numbers…
-
Dictionary of Numbers extension adds context to numbers
We read and hear numbers in the news all the time, but it…






 Visualize This: The FlowingData Guide to Design, Visualization, and Statistics (2nd Edition)


